In the daily operations of a warehouse or distribution center, not all carriers are equal. Some arrive on time, with paperwork in order, and finish their dock operation in 40 minutes. Others show up 60 minutes early flooding the yard, accumulate no-shows, and their trucks spend 3 hours at the dock. Yet most logistics operators treat everyone the same: first come, first served.
AI-powered carrier scoring changes that dynamic. Instead of relying on the guard's memory or informal complaints, the system automatically rates each carrier with an objective score based on real operational data. That score determines who gets priority when a dock opens up, who waits longer, and who needs a serious conversation about their performance.
According to Inbound Logistics, AI applied to supply chain management can reduce total operating costs by 10-20%. One of the areas where it has the greatest impact is carrier management, where decisions have historically been made by gut feeling instead of data.
A carrier scorecard assigns performance metrics to each carrier. Instead of "I think that carrier is reliable," you get "the numbers say they fulfill 94% of their appointments." DataDocks puts it simply: from hearsay to data.
In the context of a busy distribution center, carrier scoring solves real problems:
The difference between a traditional scorecard (a spreadsheet someone updates monthly) and an AI-powered one is that the latter feeds automatically from every operation, in real time, with no manual intervention.
A single metric isn't enough. If you only measure punctuality, you miss the carrier who shows up on time but takes 3 hours to unload. The scoring needs to cover four dimensions:
Punctuality is the most important pillar of scoring. But "punctual" doesn't only mean "not arriving late." An intelligent system must also detect excessively early arrivals.
A truck arriving 60 minutes before its appointment may seem responsible, but it's actually occupying yard space, consuming the security guard's time, and competing for docks with trucks that do have appointments for that hour. It's as real a problem as arriving late, but one that traditional scorecards completely ignore.
How punctuality detection works:
This dual approach — penalizing both late and early arrivals — incentivizes carriers to arrive within their appointment window, neither before nor after.
No-shows are the silent enemy of dock utilization. Every appointment a carrier doesn't fulfill is a dock that could have been assigned to another truck. In a DC with 12 docks and 80 daily appointments, a 10% no-show rate means 8 dock-hours wasted every day.
Scoring measures the inverse rate: what percentage of scheduled appointments were actually fulfilled. A carrier with 95% attendance gets a high score; one with 70% drops dramatically.
This dimension captures problems that aren't about punctuality or attendance, but about operational behavior:
Incidents are recorded during the check-in process and classified by severity. A carrier that accumulates frequent minor incidents will see their score degrade gradually.
Efficiency measures how long each truck takes from dock assignment to operation completion. A carrier who frees the dock in 45 minutes opens the way for the next truck; one who takes 2.5 hours blocks the entire queue.
The system compares the carrier's average operation time against the organization's target (typically 60 minutes for standard operations). Trucks that consistently exceed the maximum acceptable time (180 minutes) receive the lowest rating in this dimension.
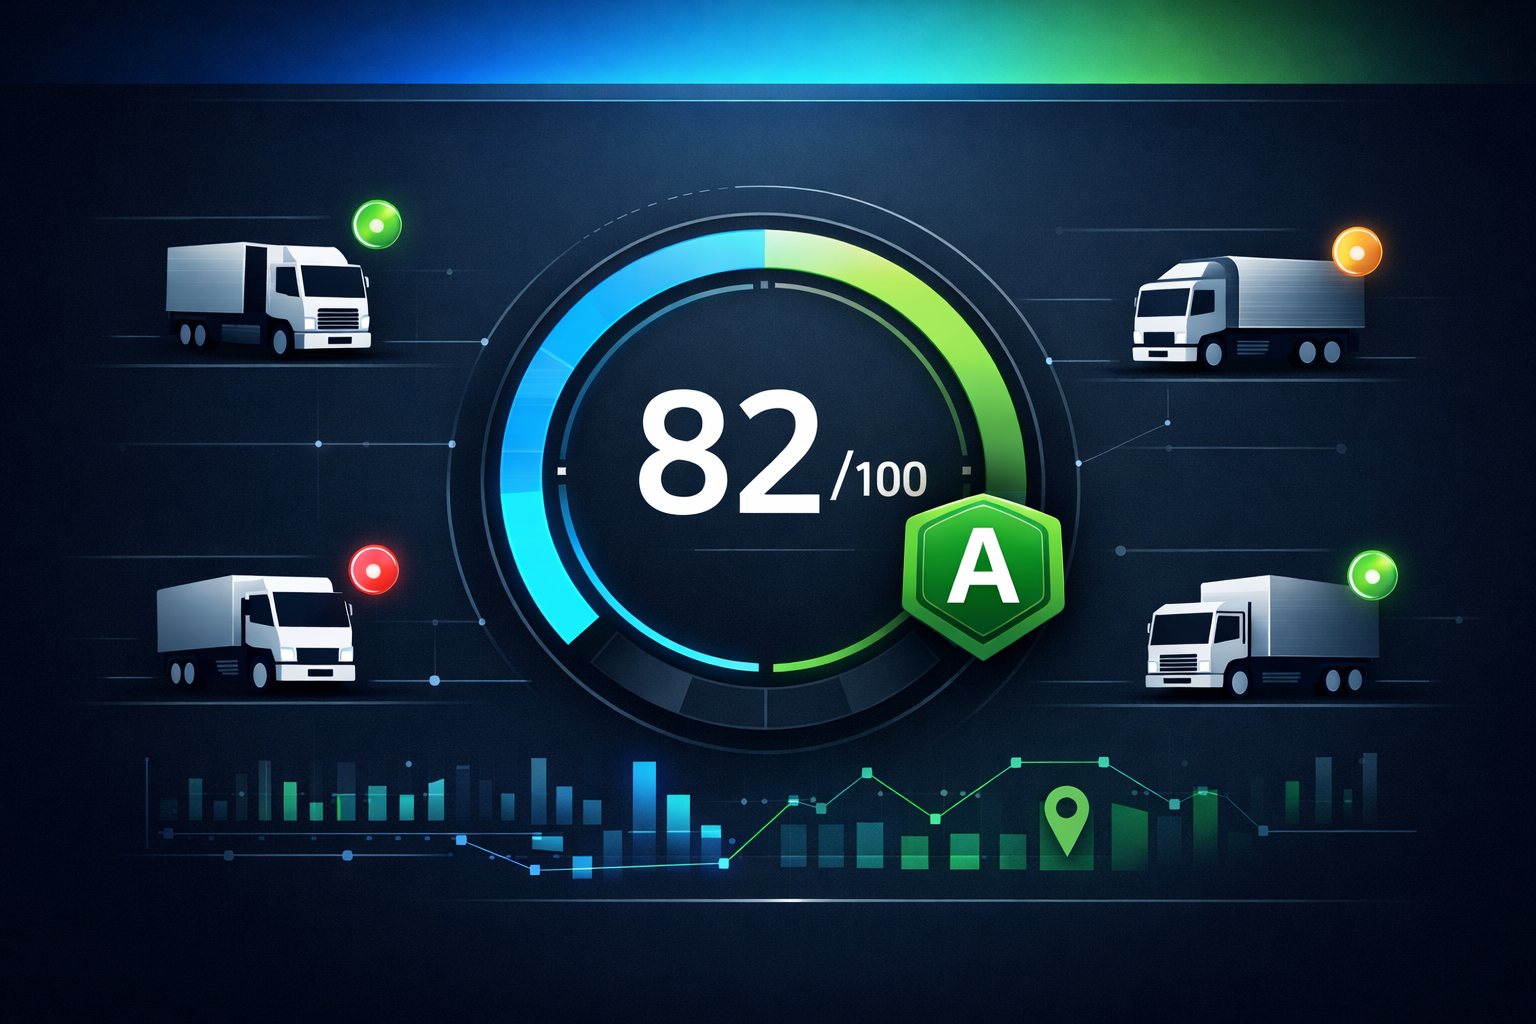
The numerical score (0-100) translates to a grade scale that simplifies communication:
| Grade | Range | Risk level | Meaning |
|---|---|---|---|
| A | 80-100 | Excellent | Reliable carrier, maximum priority |
| B | 60-79 | Regular | Good performance with room for improvement |
| C | 40-59 | At risk | Needs attention and follow-up |
| D | 20-39 | High risk | Serious performance issues |
| F | 0-19 | Critical | Consider discontinuing the relationship |
Thresholds are configurable per organization. A DC with strict compliance standards (like Walmart or Amazon suppliers) might raise the "Excellent" threshold to 90.
A common mistake in scorecards is giving equal weight to an operation from 6 months ago and one from yesterday. An intelligent system weights by recency:
This time-window composition means a carrier that improves their performance sees quick results in their rating, but a single bad day doesn't destroy months of good work. The 40/60 balance is configurable based on each operation's needs.
A number in a report is useless if nothing changes. What matters is what happens with that number in daily operations:
When a dock opens up and 3 trucks are waiting, who gets assigned first? Without scoring, it's by arrival order. With scoring, the system considers the carrier's grade as a factor in the decision. A grade-A carrier gets priority over a grade-C carrier, incentivizing good performance.
When a truck finishes earlier than expected and frees a dock, the system generates reassignment proposals ranked by the candidate carrier's score. The administrator sees: "Truck ABC-123 (Grade B, score 72) is the best candidate for the newly freed dock" and can accept or reject with one click.
Carriers can see their own grade and score in the appointment portal. They know their rating affects dock assignment priority, which creates a behavioral incentive: arriving on time, fulfilling appointments, and operating efficiently has a tangible reward.
When a carrier's grade drops (for example, from B to C), the system automatically sends an email notification. The message includes the previous grade, the new grade, the current score, and recommendations for improvement. Notifications are only sent on drops, not improvements, to avoid noise.
Your operation already generates the data needed. Every check-in, dock assignment, and departure feeds the scoring engine automatically. See how Docklyx turns that data into intelligent decisions.
Implementing AI carrier scoring doesn't require a 6-month project. In a modern system like a YMS with artificial intelligence, the infrastructure already exists:
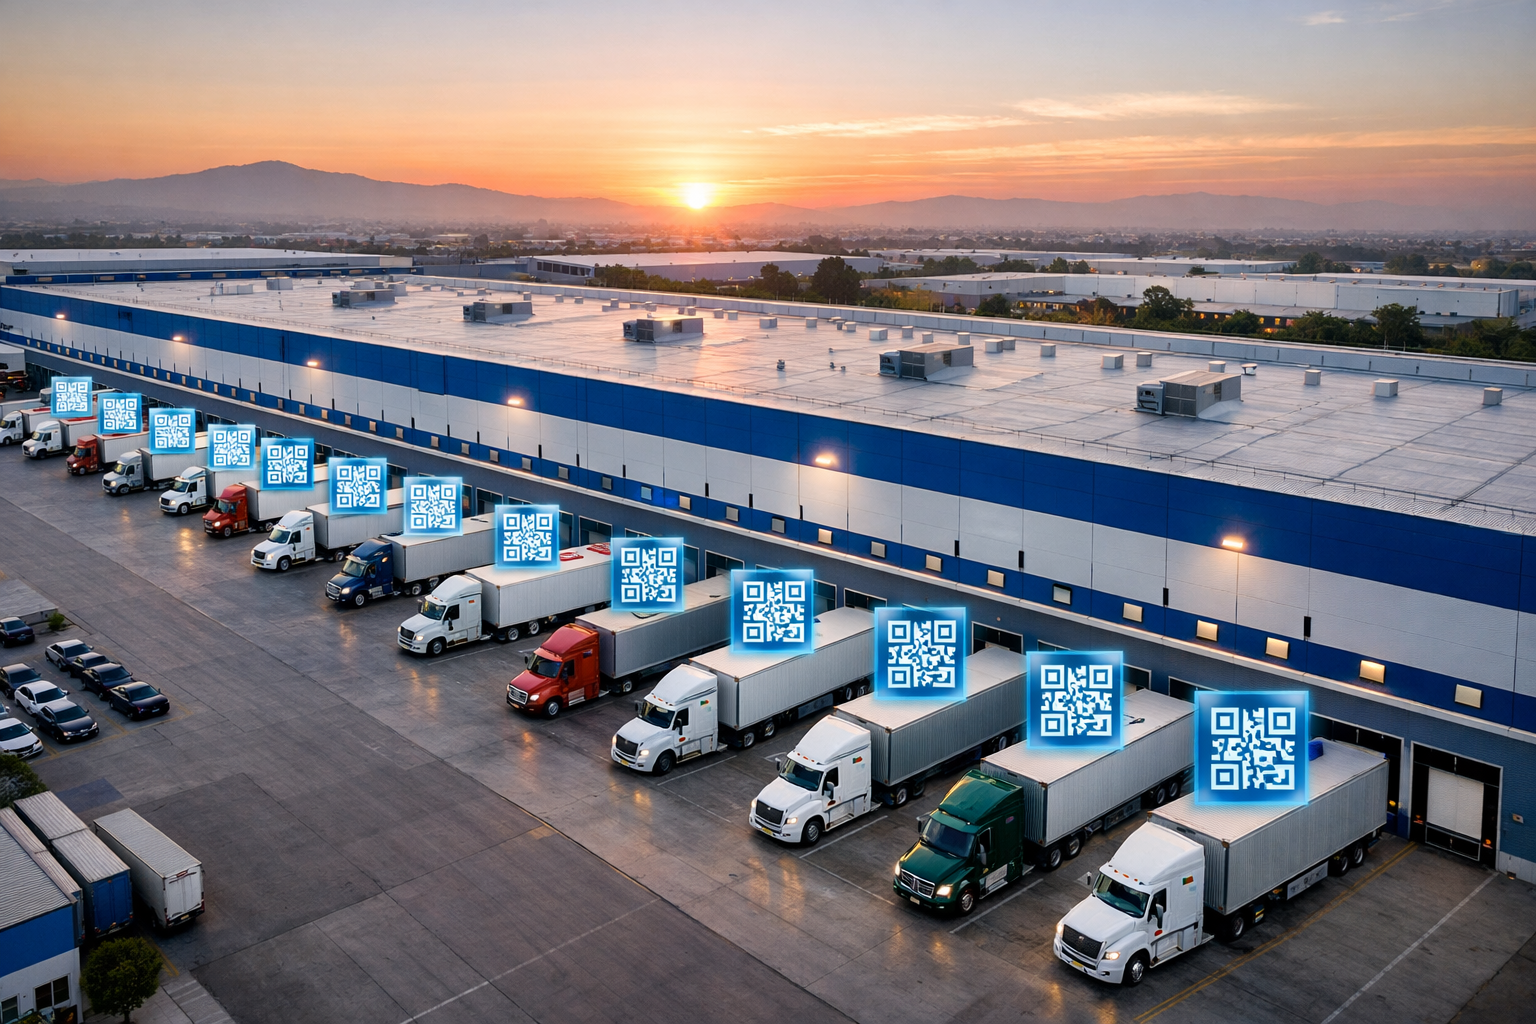
Operational data — Every check-in, dock assignment, and departure already generates the necessary data. You don't need additional sensors or complex integrations.
Carrier identification — The system needs to know which carrier company each truck belongs to. This is configured once when registering the relationship between license plates and companies.
Weight configuration — Administrators define what matters most for their operation. A high-rotation DC might prioritize efficiency; a sensitive-product facility might prioritize punctuality.
Minimum data threshold — Scoring requires a minimum number of appointments (typically 5 per company) before generating a reliable rating. New carriers inherit the average score until they accumulate enough history.
What actually changes? Three things.
Early arrivals drop. When a carrier knows that showing up 60 minutes early hurts their score instead of helping it, they stop appearing at 5am for a 7am appointment. Fewer trucks piling up in the yard, less chaos for the guard.
No-shows drop. A carrier who watches their grade fall from B to C because they didn't show up — and knows that means longer waits next time — has a real reason to honor their appointments.
Dock times drop. When you know your average operation takes 90 minutes and your competitors do it in 55, there's pressure to improve. And the pressure comes from data, not a verbal complaint.
According to FarEye, organizations that implement data-driven scorecards see improvements of up to 15% in punctuality and 20% in incident reduction within the first quarter.
For mature operations, the system offers advanced configurations that allow fine-tuning the scoring to match each DC's reality:
Not all late arrivals are equal. The system distinguishes between:
Configurable independently. Default is 0.5 (half the weight of a late arrival), but can be set to 0 to completely disable it if your operation doesn't have yard congestion issues.
Each DC can define:
| Aspect | Manual selection | AI carrier scoring |
|---|---|---|
| Decision speed | Minutes (call, ask, decide) | Seconds (automatic ranking) |
| Objectivity | Biased by personal relationships | Based on verifiable data |
| Coverage | Manager remembers 10-15 carriers | Evaluates everyone, no exceptions |
| Consistency | Varies by who decides | Same criteria always |
| Feedback | Informal, sporadic | Automatic, real-time |
| Scalability | Breaks with >20 carriers | No practical limit |
Yes. Carriers with portal access see their grade (A-F) and score out of 100. They don't see the formula weights, other carriers' ratings, or internal decision records. The transparency is enough to incentivize improvements without revealing the complete system logic.
The system requires a minimum of completed appointments (configurable, default: 5) before assigning a rating. In the meantime, the carrier's vehicles inherit the company-level score. If the company is also new, they operate without scoring until reaching the threshold.
Not directly, but you can adjust thresholds and penalties at the organization level. If you need to treat a carrier differently, the policy configuration allows flexibility without creating manual exceptions that degrade system integrity.
The score is recalculated automatically after every relevant event: check-in, appointment completion, no-show recording, or incident resolution. It's not a nightly batch process; it's real-time.
At its core, carrier scoring is simple: stop guessing who's a good carrier and start measuring it. Every arrival, every no-show, every minute at the dock gets recorded and weighs into a score that everyone can see.
AI adoption in logistics is accelerating. According to The Logistics World, 72% of Mexican companies adopted AI at a basic level in 2025, and the 2026 trend is to integrate it as the central axis of efficiency and competitiveness. Carrier scoring is one of the first places where that integration generates measurable and immediate ROI.
If your operation still decides dock priority by arrival order or by personal relationship with the carrier, you're leaving money on the table. The data already exists in your system — you just need an intelligent engine to turn it into decisions.
Related articles:
Docklyx digitizes the entire yard: appointments, check-in, docks, and real-time traceability.
Request free demo →One email per week. No spam.

Compare YMS vs WMS vs TMS for your DC, avoid overlap, and choose the rollout order that cuts delays. Read the decision guide.
Discover what a YMS is, how it works, and why it's essential for optimizing your distribution center or warehouse yard in Mexico.