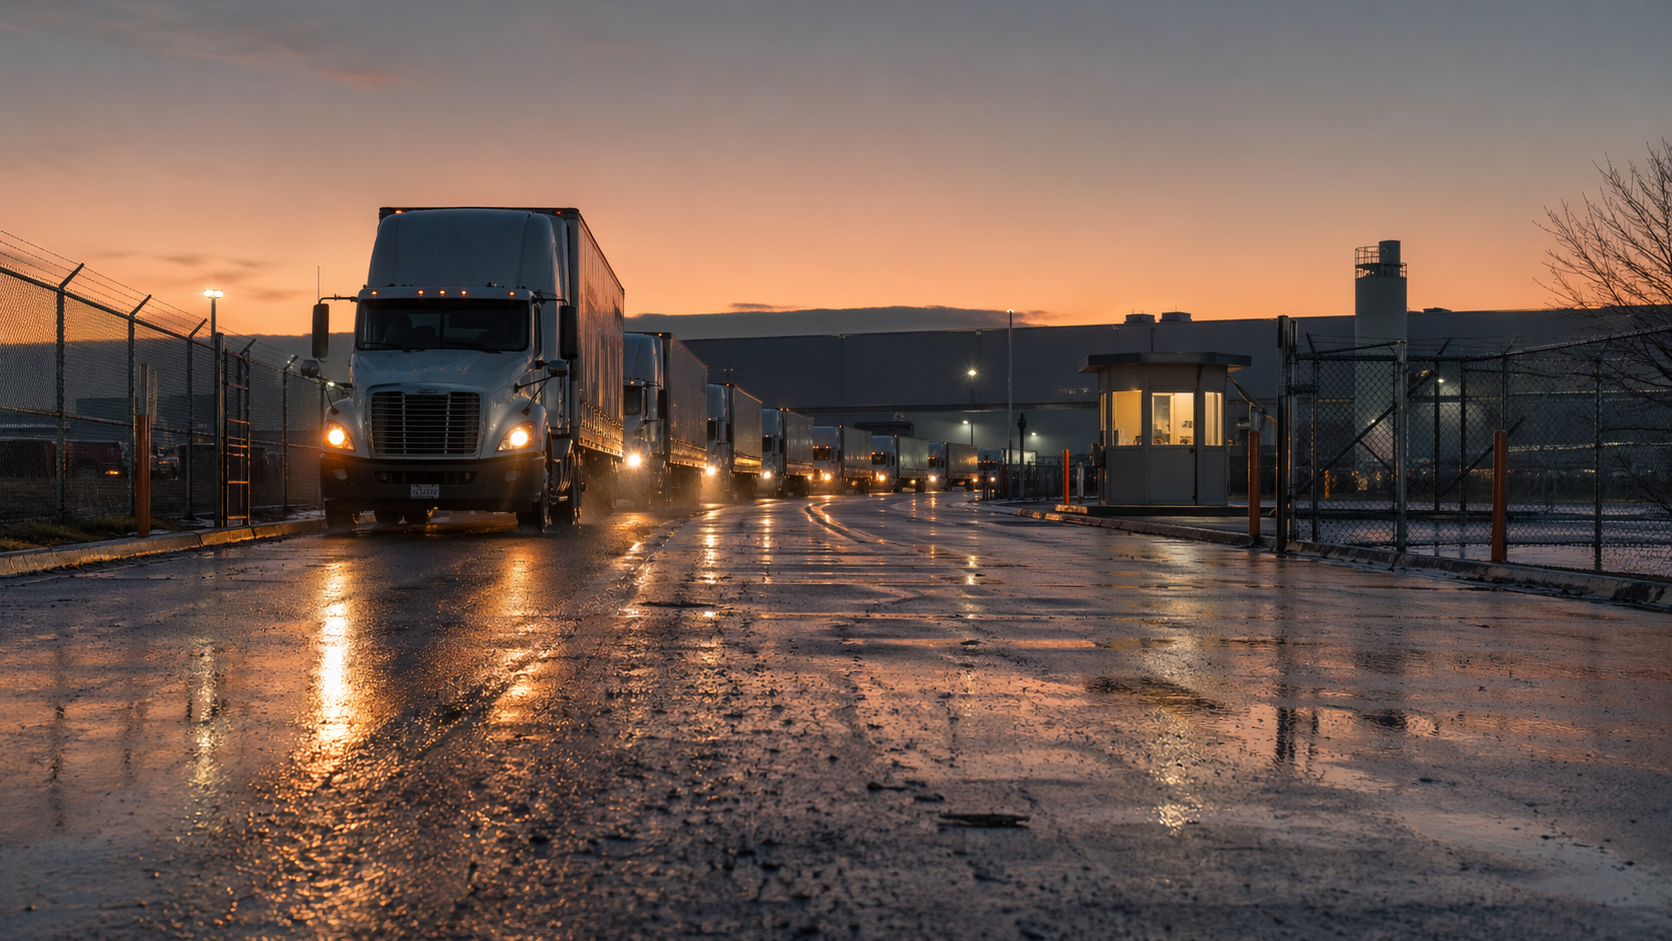
Peak season is five weeks away. If your last volume surge ended with trucks double-parked in the yard, docks backed up for hours, and guards overwhelmed at the gate, you have exactly that window to fix what broke.
This is not hypothetical. Peak season volume surges of 50–100% above baseline are standard in North America. In Mexico, Buen Fin 2025 generated $219 billion pesos in revenue — up 26.6% from 2024 — across 216,000 businesses. Every peso of those sales became boxes flowing through a distribution center. At many of those DCs, the bottleneck was not inventory or picking. It was the yard.
Here is what you need to adjust in your dock, yard, and gate operations before the next volume spike — whether it is a seasonal promotion, a holiday rush, or year-end close.
During normal operations, a mid-size DC in Mexico receives 30 to 80 trucks per day. During peak season, that number can climb 50–100%. For an operation handling 60 trucks daily, that means processing 90 to 120 without adding a single dock door or an extra square meter of yard space.
The problem is that consequences do not scale linearly. 50% more trucks does not mean 50% more chaos — it means considerably more.
Every truck that stays longer than necessary occupies a spot another truck needs. During peak season, average yard dwell time can double because dock doors do not turn fast enough. The result: trucks parked in double rows, dangerous maneuvering, and a yard that physically cannot fit the demand.
A 2025 industry analysis documented that dock dwell time at high-utilization distribution centers averaged 128 minutes. Those 128 minutes per truck, multiplied by the volume increase, define whether your operation flows or collapses.
When a dock door does not clear on time, the next truck waits. While it waits, it occupies yard space. While it occupies space, another truck cannot enter. While it cannot enter, a queue forms at the gate. While the gate is queued, the guard cannot process check-ins at the rate the operation demands.
It is no coincidence that 36.3% of logistics companies report yard congestion as their number-one operational problem during peak season. It is not one thing failing — it is the entire chain breaking down.
Peak season makes operations more expensive, but not in ways that show up on a P&L. The most damaging costs are the ones nobody invoices because nobody measures them:
No single change solves peak season. Three areas function as a system — gate, yard, and docks — and if you prepare one while neglecting the other two, the bottleneck just moves.
At 40 trucks a day, a gate guard handles check-ins without breaking a sweat. At 100, the gate becomes the most visible bottleneck: trucks queuing to enter, impatient drivers, manual validations that take too long.
Three things to solve before the spike:
The yard is where peak season is won or lost. Physical space is rarely the actual problem — the problem is losing track of what is in each spot and how long it has been there.
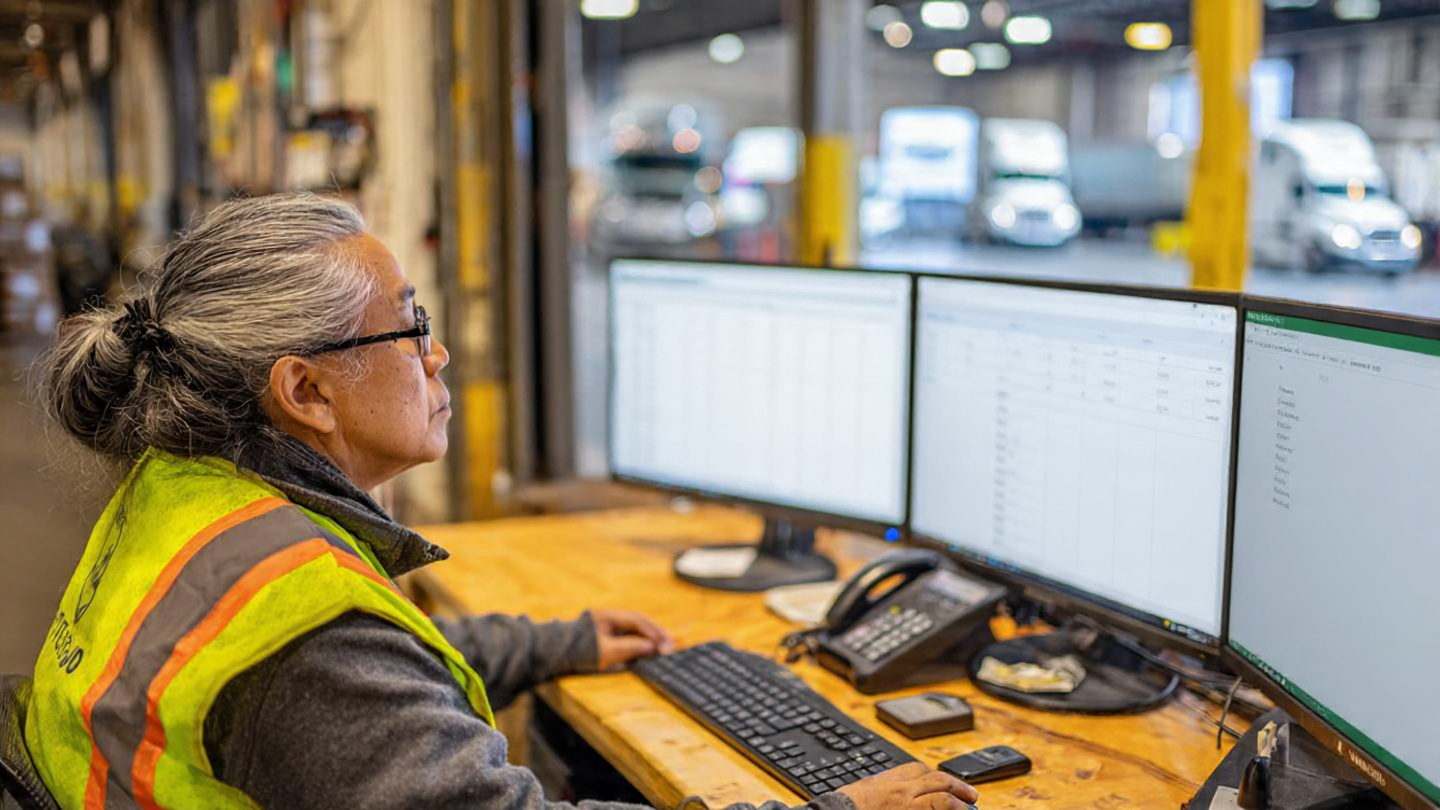
The critical KPIs to monitor during peak season include average dwell time, yard occupancy rate, and dock turns per day. If you are not measuring them today, start before the spike.
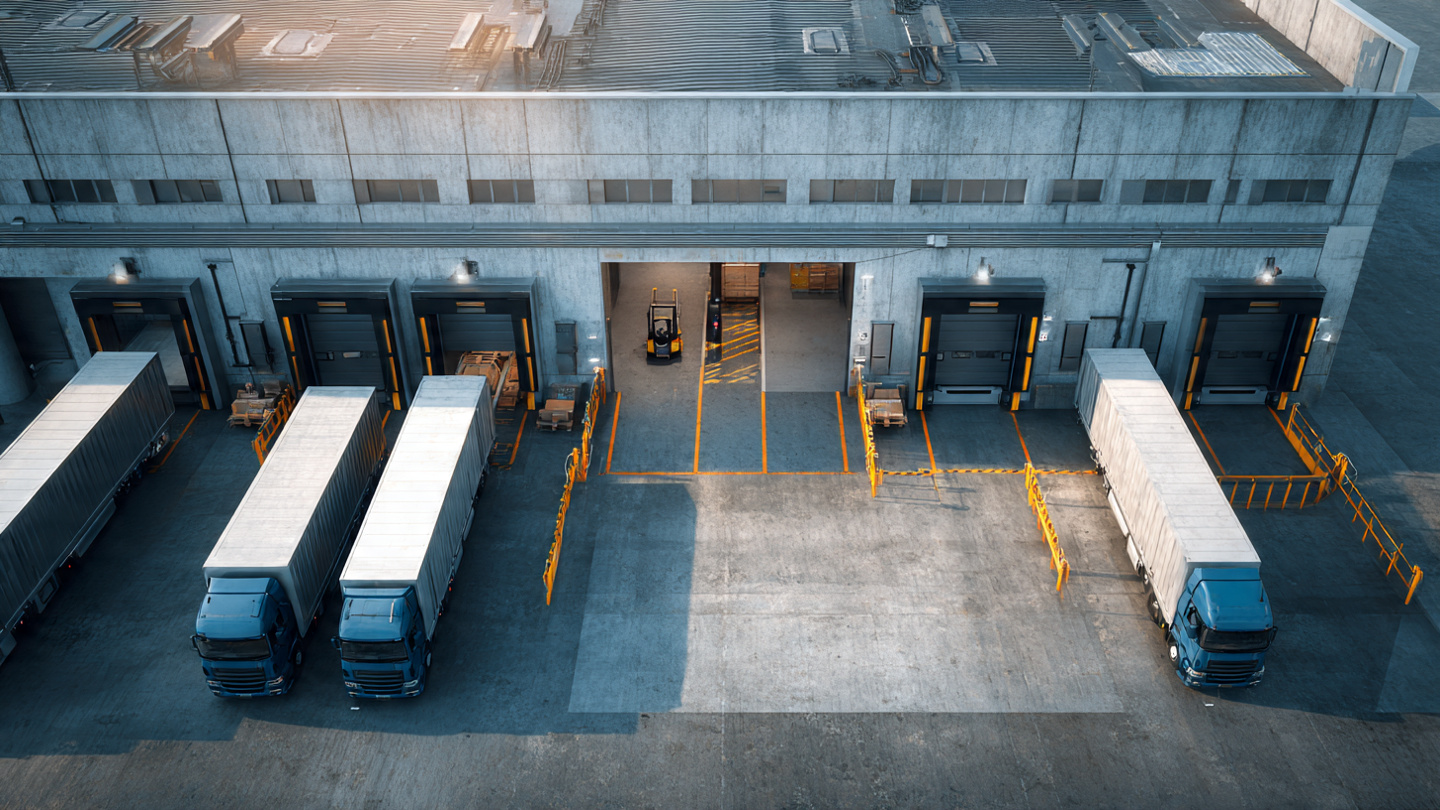
You are not building new dock doors in five weeks. But you can make each door process more trucks per day by cutting the dead time between operations.
A food distribution operator in Mexico's Bajío region faced a familiar scenario before Buen Fin 2025: three dock doors, yard space for 25 trucks, and a projection of 40% higher volume during the event week.
In previous peak seasons, the operation consistently overflowed. Gate queues stretched to 45-minute waits. Trucks stayed up to four hours in the yard waiting for a dock. And the operations team spent the week in reactive mode — solving problems instead of executing a plan.
Before Buen Fin 2025, they implemented three changes:
Results during the Buen Fin 2025 week:
They did not invest in infrastructure. They invested in process, data, and three weeks of preparation.
If you have been through a major volume surge, you will recognize at least three of these:
It seems obvious, but most DCs run peak season with exactly the same process they use in February. The logic: "we survived last time." What nobody says out loud is that "surviving" meant unplanned overtime, docks occupied twice as long as needed, and an exhausted team that took weeks to recover.
If you are implementing stricter appointment windows or a different check-in process, your carriers need to know before the event — not on the day they arrive and encounter a process they do not recognize. Advance communication reduces friction, reduces coordination calls, and allows carriers to prepare using the self-service appointment portal.
Having four dock doors does not mean you can process four trucks simultaneously if you only have two forklift operators. Your operation's true capacity is the minimum of available docks, operational staff, and yard space. During peak season, you must calculate the real constraint, not the theoretical one.
Peak season is the best opportunity to discover where your operation breaks. But if you are not measuring dwell times, check-in times, dock turns, and yard occupancy during the peak, you lose that information. What is not measured during the event is only remembered as anecdote.
Once peak season passes, the urgency disappears and nobody reviews what worked and what did not. Industry best practices recommend a post-peak analysis within two weeks of the event, while data and team memory are still fresh.
| Week | Area | Action |
|---|---|---|
| 1 | Data | Review records from your last peak (Buen Fin 2025 or holiday season). Identify the highest-volume day, average dwell time, and peak saturation hours. |
| 1 | Communication | Notify primary carriers of peak-season operating rules: appointment windows, required documentation, consequences for arriving without an appointment. |
| 2 | Gate | If using paper logbooks, evaluate migration to digital check-in. If already digital, verify it supports the target volume (trucks/hour). |
| 2 | Yard | Define or update staging zones. Physically mark areas if needed. |
| 3 | Docks | Adjust appointment windows based on actual historical load/unload times. Schedule staggered arrivals. |
| 3 | Staff | Confirm staff availability for extended shifts. Train gate personnel on peak-season check-in procedures. |
| 4 | Simulation | Run a day at projected peak volume. Identify the point where the process breaks and adjust. |
| 5 | Monitoring | Configure the alerts and dashboards you need to monitor operations in real time during the event. |
Everything above can be done with manual processes, spreadsheets, and a lot of discipline. But when volume doubles, manual discipline is the first thing that breaks. Here is how Docklyx handles each of those areas:
The dock appointment scheduling system lets you define maximum capacity per dock door and per time slot. When all windows in a shift are booked, the system automatically stops offering that slot to carriers. This prevents the overbooking that happens when appointments are managed by phone or WhatsApp without a clear cap.
During peak season, you can temporarily adjust windows (from 2 hours to 90 minutes, for example) and the system recalculates available capacity without manual intervention.
The guard scans the carrier's QR code, the system automatically validates the appointment, identity, and documentation, and assigns a yard position. All in under two minutes. No forms, no searching through a printed list, no calling the coordinator to ask whether the appointment is valid.
When you are processing 100 trucks per day instead of 60, those minutes saved per check-in translate into hours recovered per shift.
Docklyx's dashboard shows in real time how many trucks are in the yard, which zone each one is in, how long it has been there, and which ones are waiting for a dock. Excessive dwell alerts trigger automatically based on thresholds you define.
During a spike, the yard coordinator sees occupancy at 85% and can decide to temporarily halt arrivals before the yard saturates — instead of discovering it when there is no space left.
Carriers check their appointments, schedules, and required documentation directly through the self-service portal, without calling the DC. During peak season, when schedule changes and confirmations multiply, this channel dramatically reduces the coordination burden on your team.
Every volume surge exposes the same things: the gate that processes check-ins too slowly, the yard without visibility, the docks without real scheduling. And every time it passes, everyone says "next time we'll prepare." Next time is here.
If your yard still runs on paper logbooks, phone calls, and improvised dock assignments, the next peak season will cost more than the last one. The infrastructure is not going to change in five weeks. But the process can.
Docklyx digitizes the entire yard: appointments, check-in, docks, and real-time traceability.
Request free demo →One email per week. No spam.
Your docks are occupied all shift but only produce at 55-65%. Learn how to measure real per-bay productivity and reclaim installed capacity.
Your coordinator spends 3 hours a day on the phone with carriers. Here's how to eliminate those 50 daily calls without replacing a single carrier.
If your trucks are arriving at 5 AM to secure a spot, your system is training them to do it. Here's how to break the FCFS cycle at your DC.