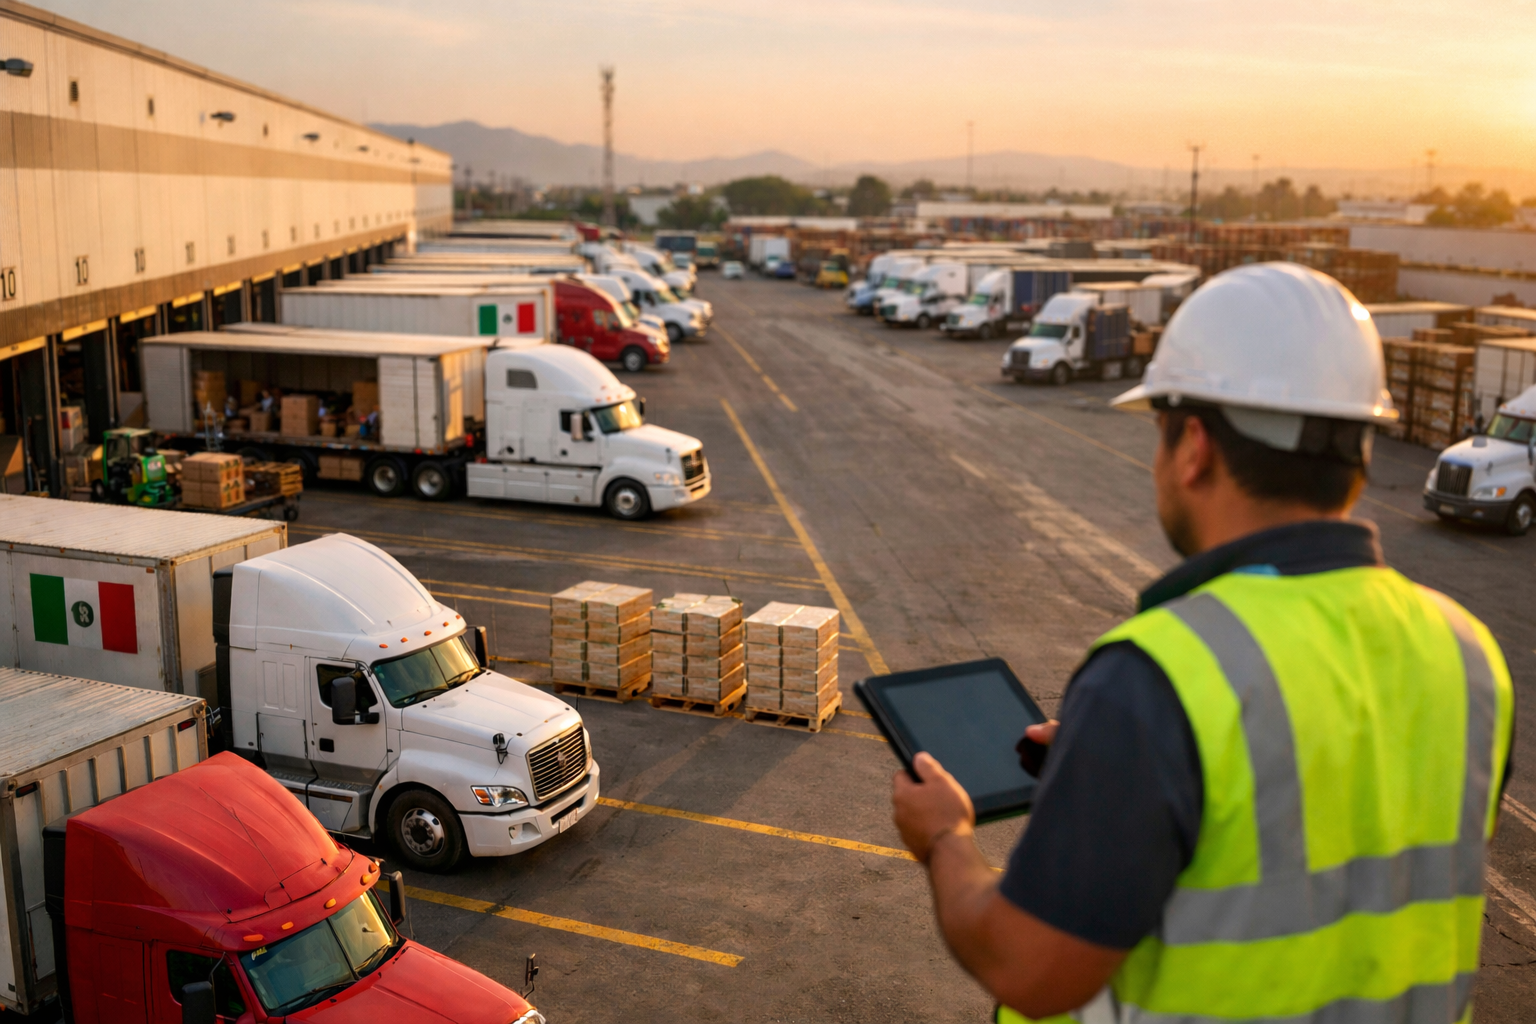
In the 2026 logistics market, characterized by high fuel prices and extreme carrier capacity constraints, a Yard Management System (YMS) is no longer a luxury—it is a financial necessity. While a top-tier YMS typically costs between $4,999 and $14,999 USD per month, viewing this solely as an expense is a mistake. Without a digital system, your operation is probably losing thousands of dollars every month through detention fees, idle labor, and inefficient asset utilization.
Logistics now represents 8.6% of Mexico's GDP, and transportation costs have surged 72% over the last decade according to industrial data (Expansion, 2025). In a market where logistics can consume up to 60% of sales value for some sectors, every hour of detention counts.
This comprehensive guide will teach you how to calculate the real Return on Investment (ROI) of a YMS, moving beyond simple cost-cutting to strategic value creation.
The basic ROI calculation is straightforward:
Monthly ROI = (Monthly Savings − Monthly Software Cost) / Monthly Software Cost × 100
However, the true challenge lies in accurately capturing Monthly Savings. Most operations managers only look at detention fines, ignoring the "soft costs" that often outweigh direct penalties. The real ROI of a YMS is the sum of eliminated direct costs, reduced indirect costs, and unlocked operational capacity.
Direct costs are the penalties paid to carriers when their equipment remains at your facility beyond the contracted "free time."
According to data from YardView (2025) and ATRI:
To find your direct cost, you need these five data points:
| Variable | Description | Example Value |
|---|---|---|
| Daily Arrivals | Average trucks per day | 30 |
| Delay Rate | % of trucks exceeding free time window | 25% |
| Avg. Delay Time | Hours exceeded per delayed truck | 2.5 hours |
| Detention Rate | Penalty cost per hour | $75 USD |
| Working Days | Operational days per month | 22 |
Calculation Example:
30 trucks × 25% (7.5 trucks) × 2.5 hours × $75 USD × 22 days = $10,312 USD/month
Even with conservative estimates, a mid-sized facility loses over $10,000 USD monthly just on detention penalties. This cost alone typically covers the monthly subscription of a Pro-level YMS.
To dive deeper into how these fees work in the regional market, see our complete guide to demurrage in Mexico.
Indirect costs are harder to track but have a massive impact on your bottom line. These represent the "friction" in your manual process.
In a manual yard, a security guard spends up to 3 hours per shift just answering phones and radio calls:
Dock supervisors in non-digital yards spend 1-2 hours daily manually coordinating trucks, resolving priority disputes, and walking the yard to verify trailer positions.
This is the most expensive hidden cost. When carriers consistently wait 3+ hours at your DC, they react by:
According to ATRI (2025), every hour of waiting costs a carrier between $50 and $90 USD in lost productivity. If you don't respect their time, you will pay a "premium tax" on every shipment you make. Learn more about tracking these relationships in our guide on logistics yard KPIs.
Based on industry research and real-world implementations, here is what you can realistically expect to save.
| Source | Reported Impact |
|---|---|
| Kimberly-Clark (FourKites) | 52% reduction in detention; $448k savings in 30 days. |
| McKinsey & Company | AI-driven logistics implementations show 25% reduction in total op-costs. |
| C3 Solutions | Up to 90% reduction in detention fees; 30% dock productivity boost. |
| Terminal Industries | 85% reduction in gate transaction times. |
The McKinsey study of 127 AI-integrated warehouses showed an average payback period of 11 months, but for yard-specific software like Docklyx, the return is often much faster because the "pain points" (fines) are so immediate.
| Feature | Small DC (5 Docks) | Mid-Sized DC (18 Docks) | Enterprise DC (40+ Docks) |
|---|---|---|---|
| Daily Trucks | 15 | 45 | 100+ |
| Current Monthly Loss | $7,800 USD | $31,500 USD | $135,000+ USD |
| YMS Reduction (Est.) | 55% | 73% | 70% |
| Gross Monthly Savings | $4,290 USD | $22,995 USD | $94,500 USD |
| Software Cost | $4,999 USD (Starter) | $14,999 USD (Pro) | ~$30,000 USD (Ent.) |
| Net Monthly ROI | -14% (Break-even focus) | 53.3% | 215% |
| Payback Period | 6 Weeks | 12 Days | 4 Days |
Note on Small Operations: If you receive fewer than 10 trucks a day, the ROI may not be immediate in dollar terms. However, the strategic value of the data and the elimination of security risks often justify the cost as a "foundational" investment.
A major regional distribution center in Guadalajara, Mexico was struggling with massive congestion. Their stats before implementing Docklyx were:
The Intervention: They implemented Docklyx's appointment scheduling and digital check-in. They forced all carriers to use a WhatsApp-based booking bot.
The Result: In 60 days, their detention costs dropped by 73%. They saved enough in the first 8 days of the second month to pay for the entire year of software subscription. You can read the full case study here.
Docklyx is designed to capture ROI from day one by targeting the three biggest "money leaks" in your yard:
Docklyx replaces the morning queue with a Self-Service Appointment Portal. Carriers book their own slots based on your warehouse's hourly capacity.
Guards use the Docklyx Guard App on a tablet to scan the carrier's QR code.
Instead of the supervisor calling carriers, Docklyx sends automated WhatsApp notifications: "Dock 5 is ready. Proceed now."
Docklyx generates "Carrier Scorecards" showing exactly which carriers are late and which facilities are causing the delays.
In 2026, the question isn't whether you can afford a Yard Management System—it's whether you can afford the status quo. If you are a mid-to-large scale operation, you are likely losing more money in the next two weeks of manual operation than the cost of an entire year of Docklyx.
ROI isn't just about saving money; it's about gaining the visibility and control needed to scale your operation in an increasingly competitive market.
Ready to regain control?
Calculate your custom ROI with our interactive tool → Start your 14-day Free Trial of Docklyx today → Start your 14-day free trial today →
Docklyx digitizes the entire yard: appointments, check-in, docks, and real-time traceability.
Request free demo →One email per week. No spam.