"You can't improve what you don't measure." In the high-stakes world of yard logistics, this management axiom isn't just a suggestion; it's the difference between a profitable operation and one losing money through hidden inefficiencies. According to recent McKinsey & Company reports, companies that automate their transportation and yard movements see up to a 30% increase in productivity. Yet, for many Distribution Centers (CEDIS), the yard remains a "black hole" of data.
While most organizations have rigorous visibility inside the warehouse (via WMS) and on the road (via TMS), the space in between—the yard—is often managed with clipboards, Excel sheets, and guesswork. This lack of data is costly: Gartner research indicates that 27% of distribution centers identify the receiving dock as their most congested area. Without precise logistics yard KPIs, you are flying blind.
In this comprehensive guide, we will analyze the 7 critical metrics every logistics leader must track in 2026, backed by industry benchmarks and a detailed look at how to automate this visibility using Docklyx.
The logistics market changed. Supply chains still move goods, but the harder part is managing time without wasting it. In 2024-2025, regional bottlenecks and rising labor costs (which rose 9.5% year-over-year) have made yard efficiency a top priority for Chief Supply Chain Officers (CSCOs).
Measuring yard KPIs allows you to:
What it measures: The total duration a transport unit spends within your facility limits—from the moment it checks in at the gate to the moment it clears out.
The 2025 Context: While global port dwell times fluctuate, the inland truck-bound average has stabilized at approximately 2.62 days, though high-performing facilities aim for a turnaround of under 45 minutes for standard appointments.
Why it matters: Dwell time is the "master metric." It aggregates every delay in your process. If dwell time is high, your demurrage costs are likely skyrocketing.
Formula:
Exit Timestamp - Entry Timestamp = Total Dwell Time
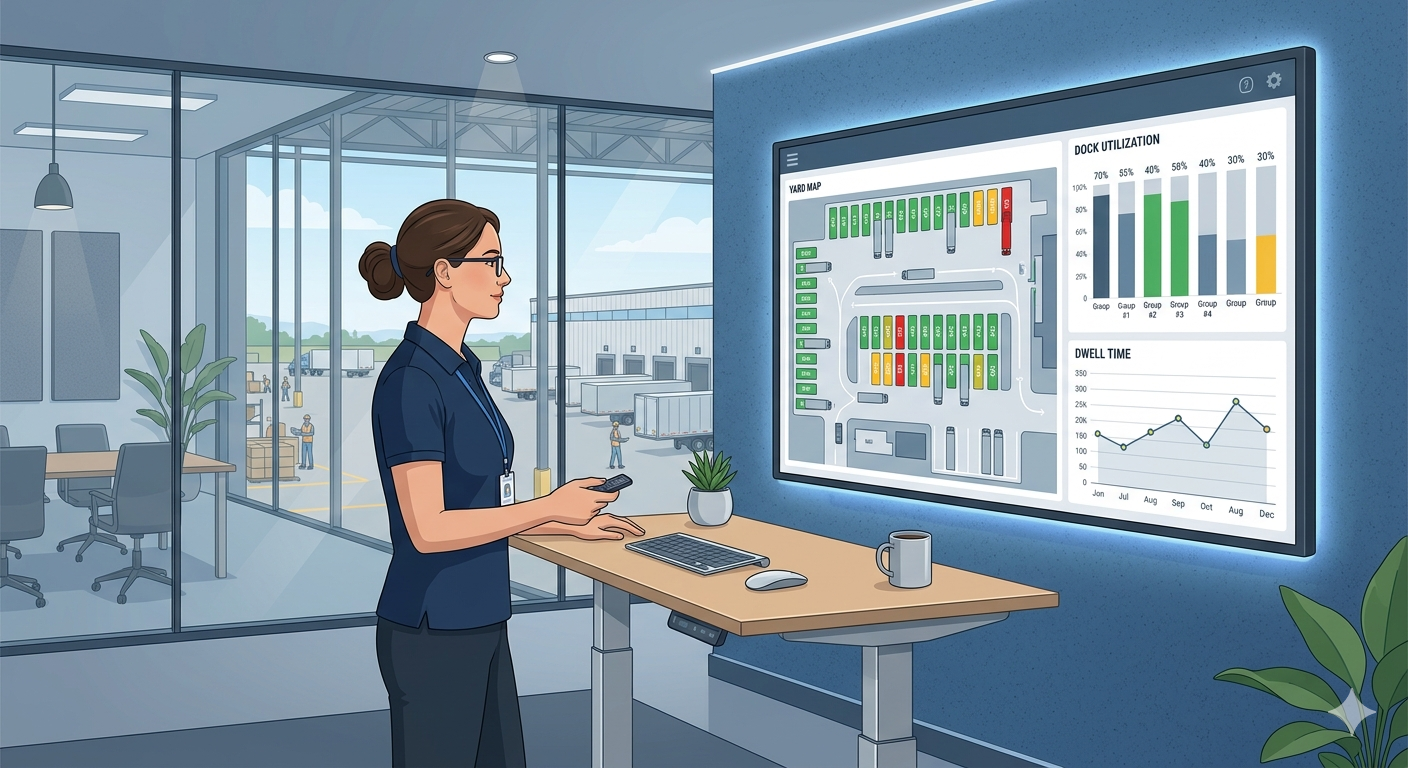
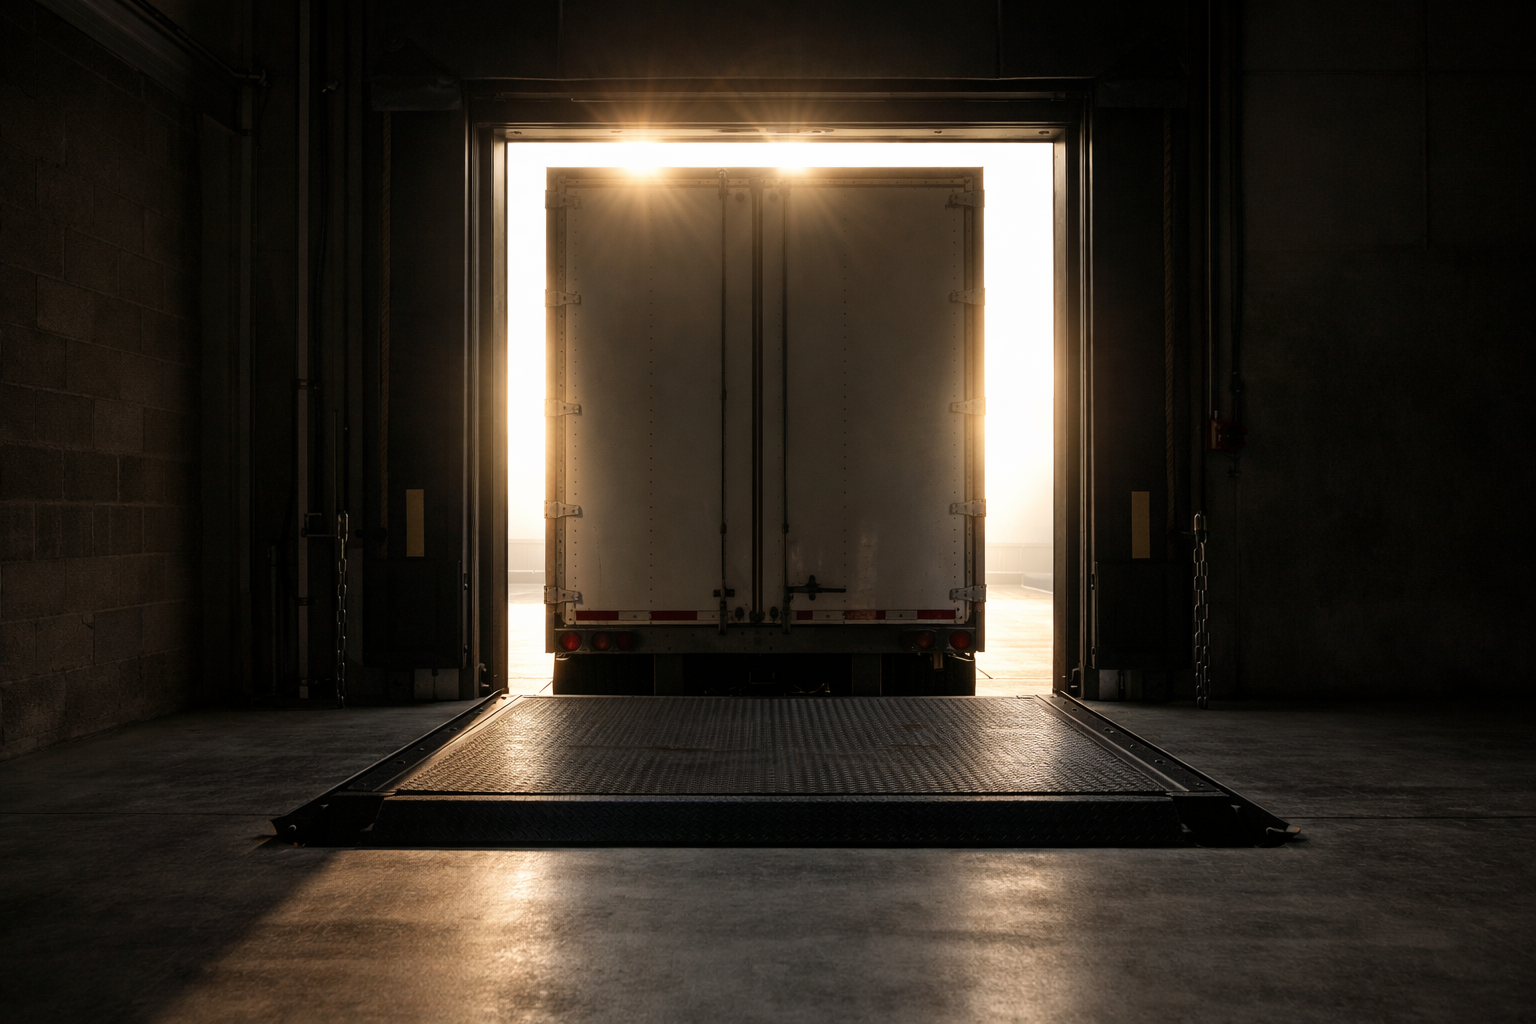
What it measures: The percentage of available hours that each dock is actively engaged in loading or unloading operations.
Industry Benchmark: High-performing facilities target a 70-80% utilization rate. Pushing beyond 85% often results in "yard gridlock," where the lack of buffer space causes systemic delays. Conversely, rates below 50% suggest serious idle capacity and poor appointment scheduling.
Why it matters: Low utilization is often a symptom of poor dock appointment scheduling. It means you have the infrastructure but lack the coordination to use it.
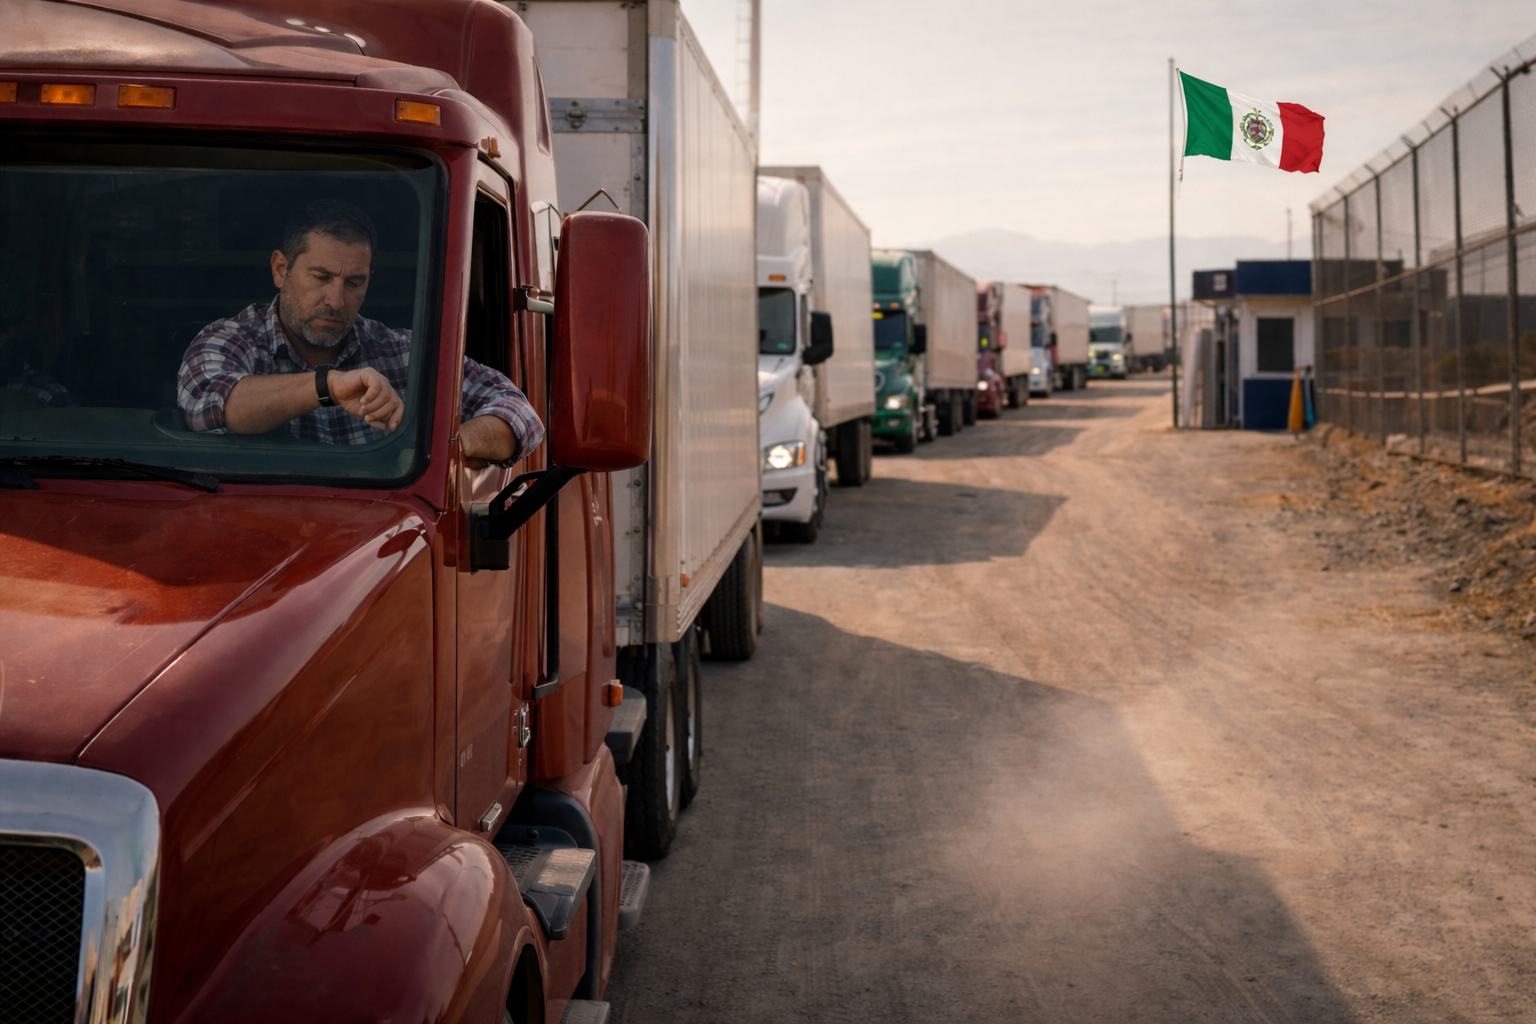
What it measures: The interval between a truck's arrival at the gate and its authorization to enter the yard.
The Benchmark: With a digital check-in system, the target is under 2 minutes. Manual, paper-based processes often drag this metric to 15-20 minutes, creating immediate congestion on public access roads.
Why it matters: Every minute spent at the gate is a minute deducted from the carrier's productive driving time and a minute added to your facility's congestion.
What it measures: The percentage of carriers arriving within their scheduled time window (typically +/- 15 or 30 minutes).
Industry Benchmark: The 2025 industry average is roughly 78%, but industry leaders demand >92%.
Why it matters: If your carriers aren't on time, your labor planning inside the warehouse fails. Tracking this KPI by carrier allows you to conduct objective performance reviews and apply penalties or incentives based on hard data.
What it measures: The percentage of visits that exceed the contracted "free time," resulting in financial penalties.
Financial Impact: Average daily penalties now range from $75 to $300 per container/trailer. For many companies, D&D fees consume 10-20% of their total shipping budget.
Why it matters: This is the most direct "ROI metric" for implementing a YMS. Reducing this rate from 15% to 3% can save a medium-sized CEDIS hundreds of thousands of dollars annually. You can calculate your potential ROI here.
What it measures: The time elapsed from when a trailer hits the dock to when the doors are closed and it is ready for movement.
Benchmark: This varies by product type, but important part is segmentation. Inbound palletized vs. outbound floor-loaded operations should be measured separately to identify specific bottlenecks.
What it measures: The total volume of units fully processed per time period.
Why it matters: This is your yard's "heart rate." If your throughput is flat but your orders are growing, your yard is the bottleneck. It helps you justify investments in automation or additional staff.
Gartner predicts that by 2028, 25% of logistics KPI reporting will be powered by Generative AI. We are moving from descriptive analytics (what happened?) to predictive analytics (what will happen?).
Modern systems can now predict:
The Challenge: A leading CPG (Consumer Packaged Goods) distributor in Northern Mexico was struggling with a 14% demurrage rate and average gate wait times of 22 minutes. They were losing approximately $12,000 per week in detention fees.
The Solution: They implemented a centralized KPI tracking system and a digital check-in portal.
The Results (90 Days Post-Implementation):
Many managers attempt to track these KPIs using manual logs. While better than nothing, manual tracking suffers from:
True optimization requires real-time, objective data capture.
Visibility shouldn't be a chore. Here is how Docklyx transforms raw yard movement into actionable KPIs in four steps:
When a truck arrives, the guard uses the Docklyx Guard App. Instead of writing on a clipboard, they scan the carrier's QR code (from their pre-booked appointment) or enter the plate number.
Entry Timestamp, starting the clock for Dwell Time and Gate Processing Time.The system verifies the appointment. If the dock is ready, the driver is directed via SMS or the app. If not, they are placed in a digital queue.
Queue Time, helping you identify if you have a Dock Utilization problem or a labor shortage.As soon as the trailer hits the dock, the warehouse supervisor marks the start of the operation in the Docklyx Dashboard.
The data is aggregated in real-time. You don't need to build reports; you simply open the Docklyx Insights tab.
Logistics yard KPIs are the heartbeat of a modern supply chain. In an era where McKinsey highlights a 30% productivity gap between leaders and laggards, you cannot afford to have a blind spot in your yard.
Measuring metrics like Dwell Time and Dock Utilization is the first step toward a leaner, more profitable operation. But capturing that data is only half the battle—acting on it in real-time is where the true value lies.
Are you ready to stop the bleeding and gain 100% visibility into your yard?
Try Docklyx free for 14 days → Calculate your potential ROI with our calculator → Learn more about AI in Yard Management →
Docklyx digitizes the entire yard: appointments, check-in, docks, and real-time traceability.
Request free demo →One email per week. No spam.
Learn to measure dock dwell time accurately, compare benchmarks by operation type, and apply 5 strategies to reduce it. Practical guide for DC operators.
Eliminate detention and demurrage costs at your DC. Learn how to calculate demurrage and reduce it by 65% with digital yard management.