
It's 10:47 AM and a truck has been parked at Dock 6 since 8:15. The unload finished at 9:40. An hour and seven minutes have passed with the seal still on because nobody told the yard the dock was clear.
That truck isn't generating value. It's generating debt: billable detention time, a blocked dock door, and the next unit in the queue adding minutes to its own clock.
This scenario plays out at hundreds of distribution centers every day. The problem has a name: high dock dwell time. And most operations aren't measuring it correctly, or measuring it at all.
This guide covers how to calculate it, what numbers are normal by operation type, and five concrete actions to bring it down. There's also a specific walkthrough of how Docklyx automates the instrumentation.
Before measuring, define precisely what you're measuring. Two metrics get conflated regularly in yard operations:
Yard dwell time: total time a transport unit spends within the facility perimeter, from gate check-in to gate check-out. Includes wait time, yard moves, time at the dock, and departure processing.
Dock dwell time: time a unit is physically connected to a dock door, from dock-in (when the truck backs in) to dock-out (when it pulls away and the dock is free). This is the metric that measures actual loading/unloading efficiency.
The distinction matters operationally. A truck can have a 3-hour yard dwell time but only 45 minutes of dock dwell time. The other 135 minutes were spent waiting in queue, doing paperwork, or waiting for instructions. Confuse the two and you diagnose the wrong problem.
This article focuses on dock dwell time. For full-yard analysis, see the logistics yard KPIs guide.
The formula is straightforward:
Dock Dwell Time = Dock-out timestamp − Dock-in timestamp
The challenge isn't the formula; it's the quality of the timestamps. There are three ways to capture them:
A supervisor writes in a notebook or spreadsheet when a truck docks and when the dock is released. In practice it suffers from three recurring failures:
The resulting data has error margins of 20-30 minutes, which makes precision analysis meaningless.
The guard or supervisor logs events in an app at the exact moment they occur. Accuracy improves to under 2 minutes of real difference. This is the minimum acceptable baseline for a DC that wants actionable data.
The system records timestamps through digital gate check-in, dock assignment, and dock release from a warehouse device. No manual intervention, no lag, no omissions.
To illustrate: if you record manually with an average error of 15 minutes and your dock dwell target is 45 minutes, you're measuring with a 33% error margin. You can't optimize what you don't measure accurately.
Acceptable dock dwell time varies by operation type. Using the wrong benchmark leads to unrealistic targets or to tolerating inefficiencies that are fixable.
Based on data from DAT Freight & Analytics and the American Transportation Research Institute (ATRI), typical ranges in ground freight operations are:
The truck arrives, docks, the warehouse team unloads or loads in real time, and the truck departs.
This is the operation type where dock dwell time has the greatest impact on detention costs, because the truck and driver are actively waiting.
The truck drops a loaded trailer, hooks an empty or pre-loaded one, and leaves. Dock time is minimal.
If drop-and-hook dwell time consistently exceeds 45 minutes, the problem is almost always trailer availability or yard coordination, not the carrier.
Freight arrives at one dock door and departs through another in the same shift, with no intermediate storage.
Cross-dock operations are the most sensitive to dwell time because any delay at the inbound dock directly blocks the outbound dock.
Single origin, single destination, homogeneous cargo.
Multiple destinations and origins, mixed freight requiring sorting during unload.
The difference between FTL and LTL times is substantial because LTL requires separating, scanning, and sorting freight from different origins during unload.
Methodology note: These benchmarks apply to general cargo operations at distribution centers in North America and Mexico. Specialized operations (temperature-controlled, pharmaceutical, hazmat) have higher times due to verification protocols.
According to the FMCSA, carriers in the US lose an average of 56 minutes per trip waiting at customer facilities. The FMCSA study puts total operational cost at $63-$87 per hour for the carrier, counting vehicle depreciation, driver cost, and idle fuel. For the shipper, that cost shows up as detention fees once the free time window expires.
For a DC receiving 30 trucks per day with an average dwell time of 120 minutes when the efficient benchmark is 75, those 45 extra minutes per truck add up to 1,350 minutes daily. That's over 22 hours of billable detention time, every day.
Every minute a truck occupies a dock after its operation is complete is capacity lost for the next unit. With 8 dock doors each losing 20 minutes of ghost time between operations, you're losing the equivalent of more than 2 full dock doors in real throughput capacity.
Carriers that consistently accumulate high dwell times are, in many cases, affected by your internal inefficiencies, not just their own performance. An AI-powered carrier scoring system that doesn't distinguish where the delay occurred can unfairly penalize efficient carriers. Measuring dock dwell time accurately lets you separate your responsibility from the carrier's.
The most common mistake: the truck arrives at the gate and dock assignment happens there. That process takes 5-15 minutes of radio calls, phone calls, and waiting, time that adds to dwell time before any operation has started.
The dock appointment scheduling system should assign the dock at appointment confirmation, factoring in operation type, freight type, and real-time dock status. When the truck arrives, the guard validates the appointment and tells the driver which dock they already have. No idle time at the gate.
One of the biggest contributors to high dwell time isn't the carrier; it's the warehouse that isn't ready when the truck reaches the dock. The truck docks but the forklift operator is on another task, or the receiving team is between shifts.
The dock management system should notify the warehouse supervisor or forklift operator the moment a truck enters the yard, not when it reaches the dock door. Those 10-15 minutes of lead time are enough to prepare equipment and have staff ready.
Without real-time visibility, high dwell time is discovered in the next day's report, after the detention has already accumulated. The problem needs to be caught while it's happening.
Configure automatic alerts that notify supervisors when a dock exceeds a defined time threshold: "Dock 4 has been active 90 minutes, exceeds 75-minute benchmark for live unload." The supervisor can intervene immediately to check for a freight issue, staffing gap, or documentation problem.
ATRI estimates that intervening within the first 20 minutes of a delay reduces the total cost of the event by more than 60%, because it prevents the delay from cascading.
The truck finishes its operation but the dock remains marked "occupied" because nobody released it in the system. The space is physically free but operationally blocked. This is the ghost dock problem.
The closing process needs to be part of the warehouse operator's standard workflow. When the shift supervisor confirms the end of operation on their device, the system releases the dock, notifies the guard, and advances the next unit in queue. If no one performs the close within a defined window, the system escalates an alert.
This one change, eliminating ghost docks, can reduce average dwell time by 10-20 minutes without touching anything else in the operation.
Reducing average dwell time with a single global action is difficult because the problem is rarely uniform. Some carriers consistently take longer. Some time windows run slower. Some freight types have inherently higher times.
Segment the analysis. Instead of "average dwell time: 95 minutes," look at:
That segmentation tells you where to act first. If Carrier B is a critical supplier, you have data for a specific conversation about their processes. If the afternoon shift is 44% slower, there's a staffing or coordination issue you can actually solve.
Before trying to reduce dwell time, spend two weeks just measuring it accurately. Most DCs don't have clean data. Without a reliable baseline, you won't know if your actions are working.
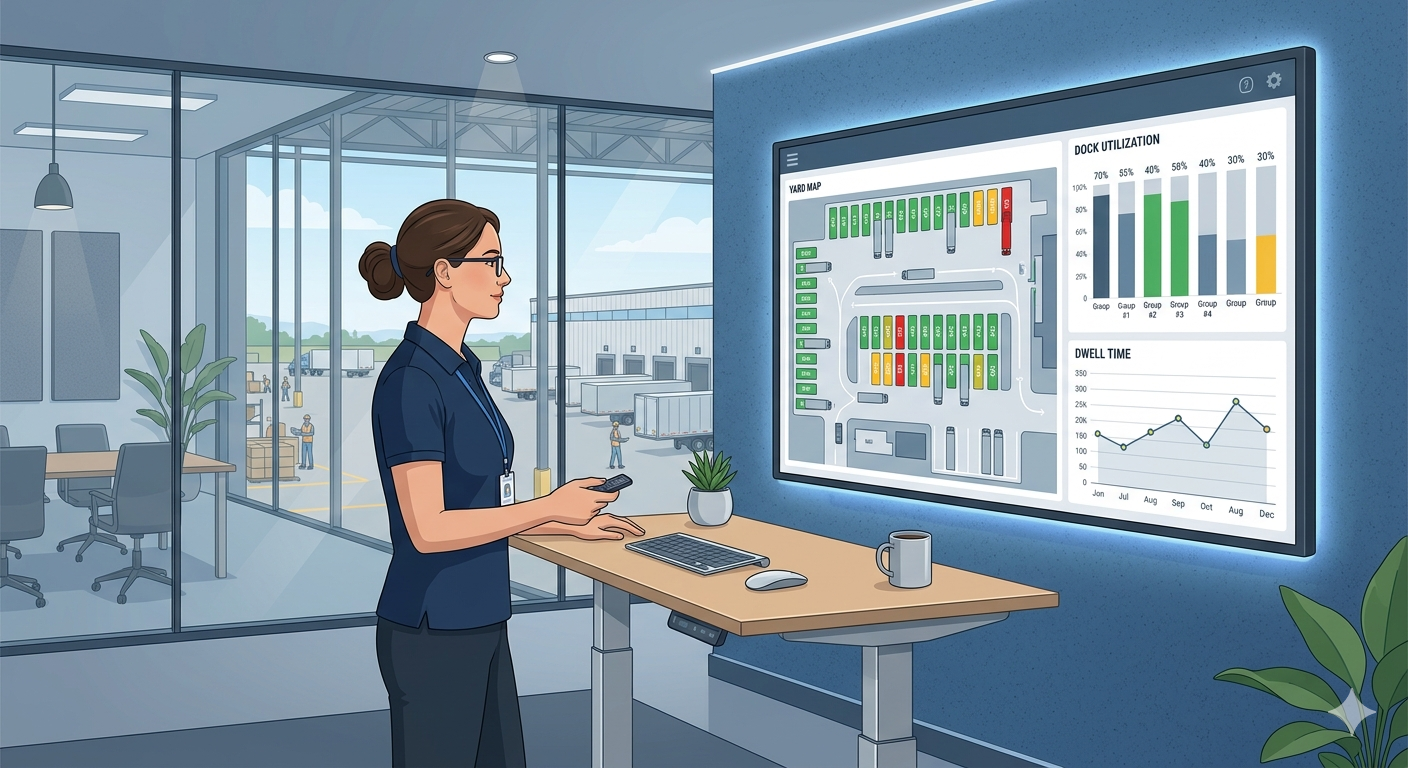
The five strategies above require precise data and real-time visibility. Docklyx instruments all of that automatically, without depending on anyone remembering to write something down.
When the guard or warehouse supervisor confirms in the Docklyx Dashboard that a unit has docked, the system records the dock-in timestamp. No spreadsheet, no manual log. The time is in the database to-the-second.
From the settings panel, the administrator defines thresholds per operation type: 75 minutes for live unload, 30 minutes for drop-and-hook, 90 minutes for cross-dock. When a dock exceeds that threshold, the system sends a push notification to the shift supervisor and escalates by email if there's no response within 15 minutes. You don't need to watch the dashboard to know something is wrong.
When the operation ends, the warehouse supervisor taps "Release dock" on their tablet or phone. The system records the dock-out timestamp, calculates the dwell time for that visit, and releases the dock for the next unit. The guard receives the notification immediately. The ghost dock problem goes away.
Docklyx's dock metrics panel shows:
The data is available while the operation is running.
The dwell time from each visit feeds into Docklyx Brain's carrier scoring. A carrier that consistently exceeds their operation-type benchmark receives a score penalty. One that finishes below benchmark gains points. That rating determines their priority when a dock opens up, which creates a real incentive to improve.
One important detail: the system separates delays attributable to the carrier (late arrival, incomplete documentation) from delays attributable to the warehouse (dock wasn't ready, staff shortage). Only the former affects the carrier score.
A consumer goods distributor with 18 active dock doors had an average live unload dwell time of 127 minutes. Their target was 75 minutes.
The first step was implementing precise measurement with digital timestamps. Data from the first two weeks revealed something they hadn't expected: 60% of the excess time wasn't happening during the unload. It was happening after the unload finished, while the dock waited to be formally released in the system.
On average, docks remained marked "occupied" for 38 minutes after the truck had physically finished. Warehouse staff completed the operation but didn't do the formal close because it wasn't part of their established workflow.
With Docklyx, dock release became the final step of the receiving workflow. The warehouse supervisor cannot close the receiving order without releasing the dock. Within 30 days, average dwell time dropped from 127 to 84 minutes. A 34% reduction with no extra staff and no changes to the unloading process itself.
The 84 minutes wasn't yet at the target, but segmented data showed the remaining 9 minutes of excess were concentrated in two specific carriers with consistently slower unload times. With that information, the operations team had the right conversation with the right carriers.
ATRI research on trucking operational costs shows that unproductive time at customer facilities represents $63-$87 per hour in total carrier cost, factoring in vehicle depreciation, driver cost, and idle fuel.
For the shipper, that cost shows up as detention fees. But it also shows up in something less visible: carriers that learn your facility runs slow and start adding a time buffer to their rates, quietly raising your transportation costs over time.
A DC with consistently low dock dwell time has more leverage in carrier negotiations, pays less detention, and attracts better-performing carriers. The metric looks operational. The impact is financial.
Docklyx digitizes the entire yard: appointments, check-in, docks, and real-time traceability.
Request free demo →One email per week. No spam.
Master logistics yard KPIs with real-time data, McKinsey benchmarks, and a Docklyx walkthrough. Reduce demurrage and boost dock efficiency today.
Eliminate detention and demurrage costs at your DC. Learn how to calculate demurrage and reduce it by 65% with digital yard management.