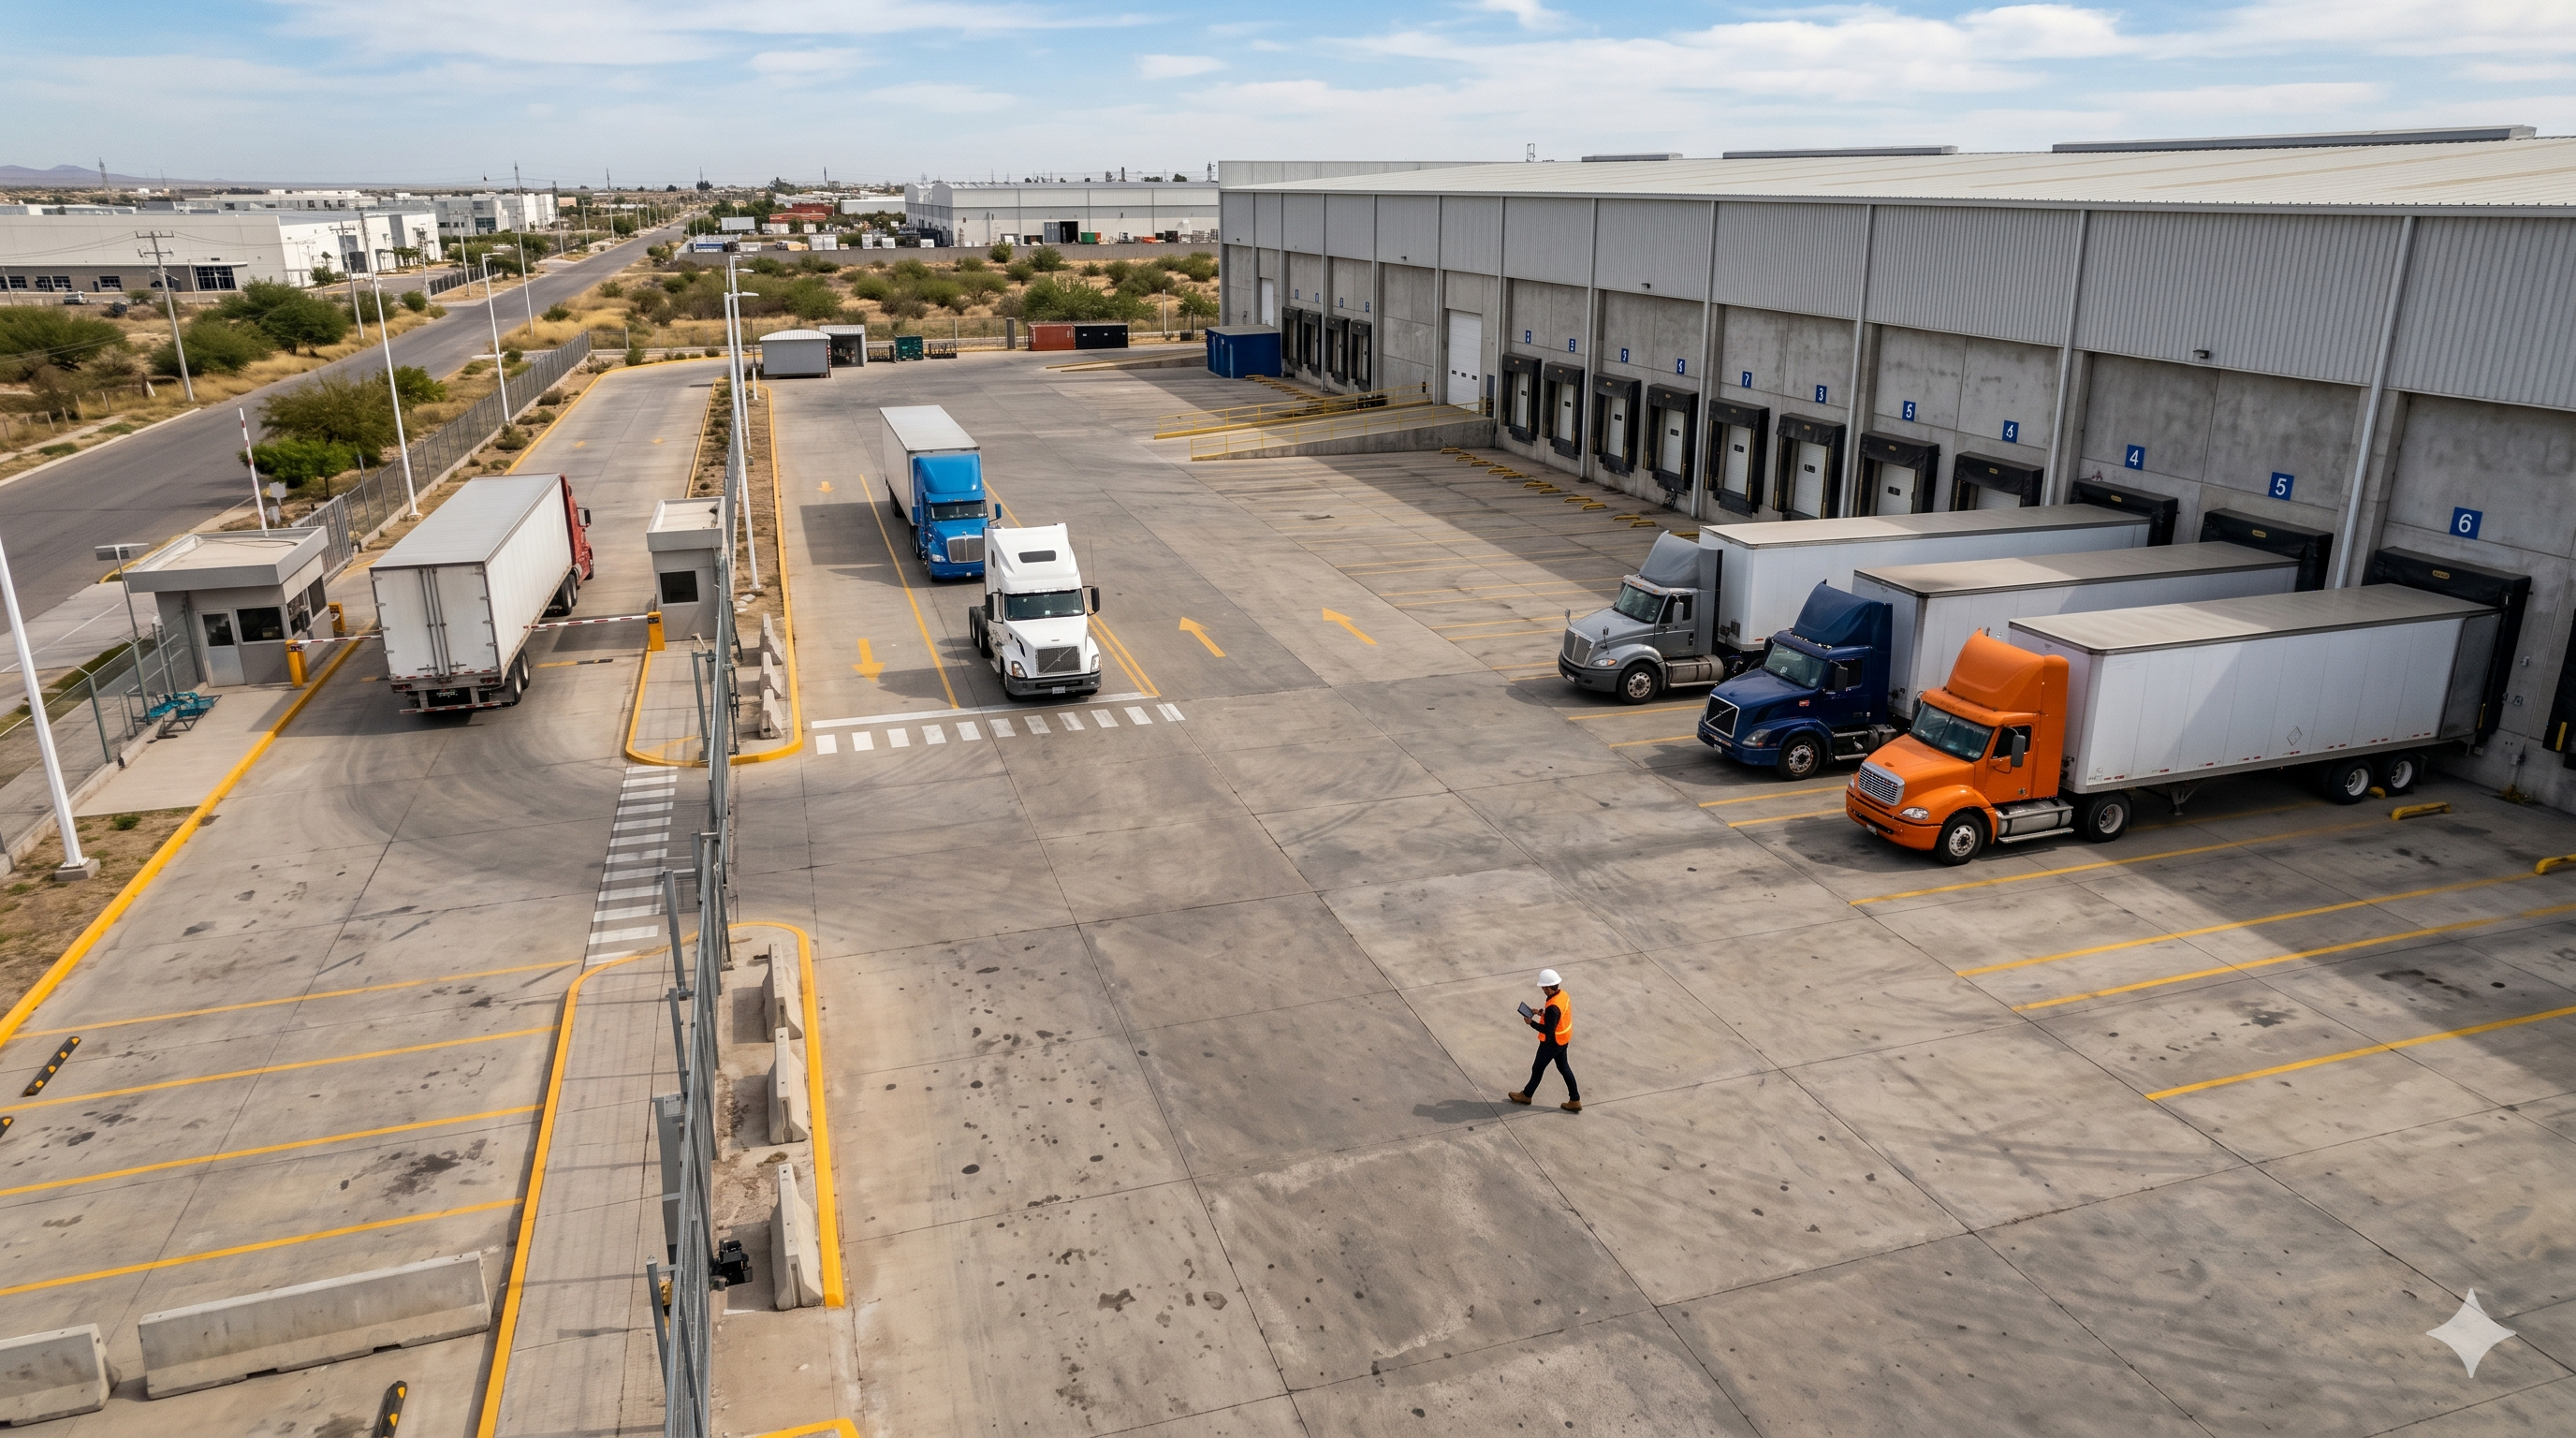
At 8:30 AM your first truck arrives. By 9:15 there are six more at the gate. By 10:00, two are still waiting for a dock. By noon, a supervisor is on the phone with carriers who want to know where their trucks went. End of shift: fewer units processed than planned, and tomorrow's queue already forming.
That pattern isn't bad luck. It's a turnaround time problem, and most DC managers don't see it until they start measuring the right thing.
Truck turnaround time is the total elapsed time from when a truck enters your gate to when it exits after completing its load or unload. Gate check-in, yard queuing, dock assignment wait, loading or unloading, departure clearance. All of it, gate to gate.
Here's why ignoring it is expensive: you can have a perfectly efficient dock, trucks loaded and unloaded in 45 minutes, and still run a slow operation because those same trucks waited 90 minutes in your yard before reaching the dock. The dock looks fine in your reports. Your throughput tells a different story.
Two terms get confused constantly in yard operations. Confusing them means you optimize the wrong thing.
Dock dwell time measures only the time a truck is physically at a dock door, from when it backs in to when it pulls away. It tells you how fast your loading and unloading runs.
Truck turnaround time (gate-to-gate cycle time) covers everything dwell time misses: arrival queue, check-in processing, yard wait, dock assignment, and departure clearance.
A truck can have a 40-minute dwell time and a 3-hour turnaround. Those extra 140 minutes aren't at the dock. They're in the yard, at the gate, and in the dead time between stages. If you only optimize dwell time, you're fixing a fraction of the problem.
For dock-level measurement and benchmarks specifically, the dock dwell time guide covers that ground in detail. This article is about what happens before and after the dock — the stages most operations leave completely unmonitored.
Every minute of turnaround time falls into one of five stages. Know where your time goes before deciding where to act.
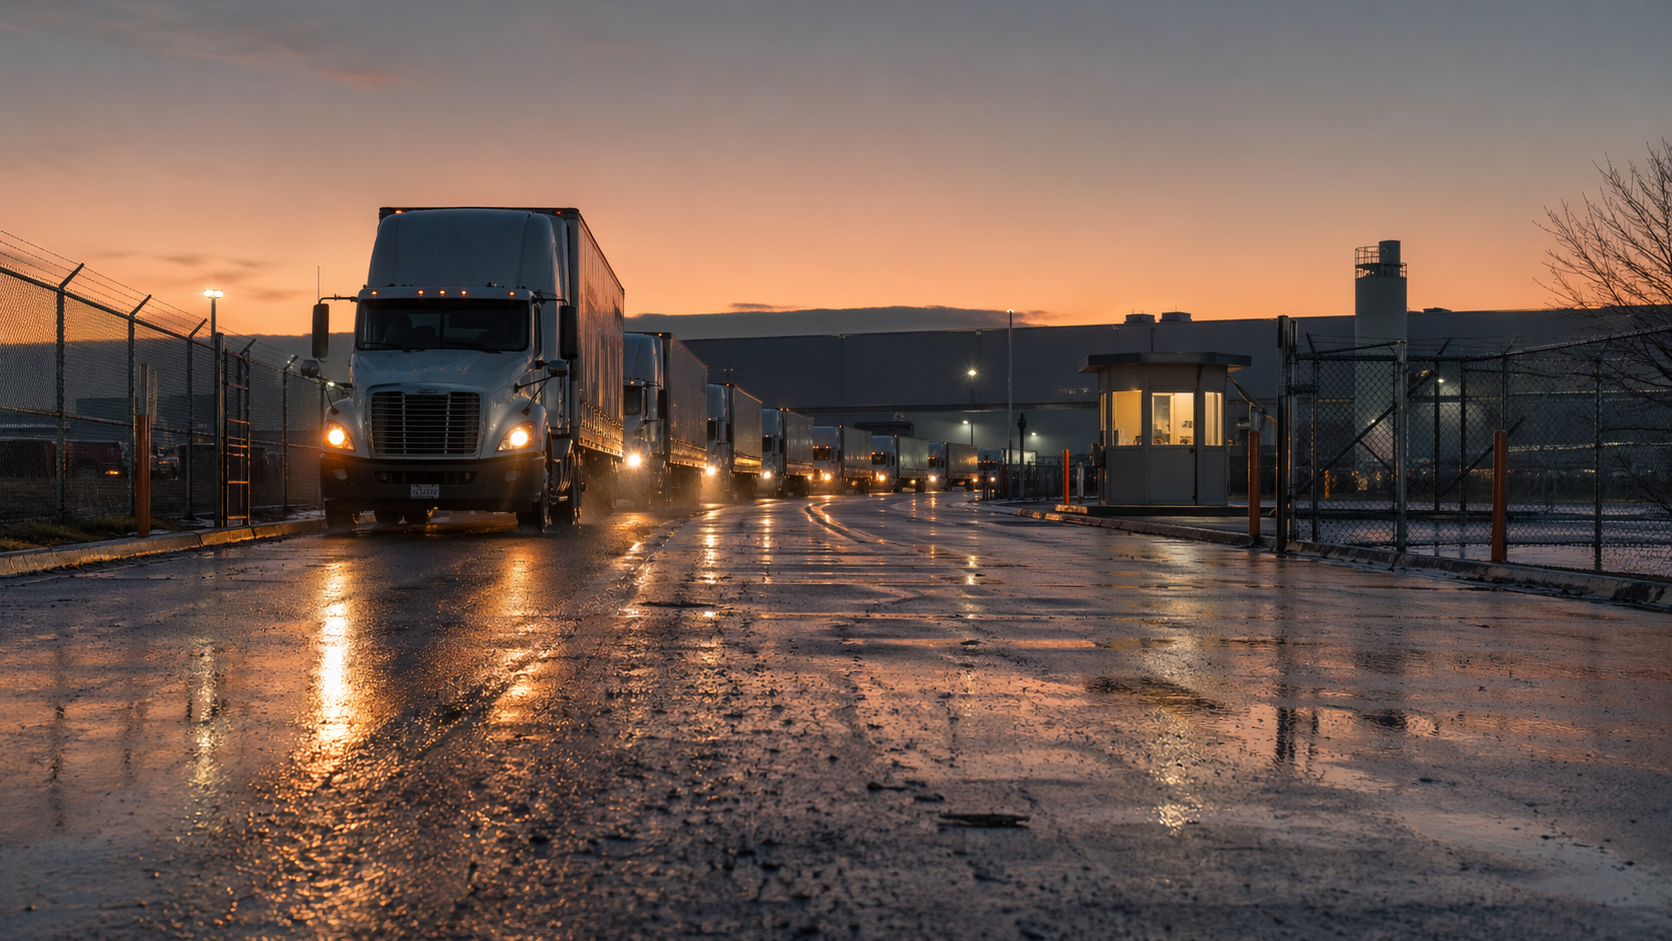
The truck arrives. Without a scheduled appointment system, it joins whatever line has formed outside your gate. In operations running first-come, first-served, that line forms early and long. Carriers arrive before opening to grab a spot, which creates a morning congestion spike that takes hours to drain.
This stage is invisible in most DC reporting because the truck hasn't checked in yet, so the system doesn't know it exists. But the space outside your gate is blocked, your guard is overwhelmed, and every truck behind the first one is already running up its own turnaround clock.
For more on how FCFS builds structural congestion into your operation by design, see why first come first served destroys your warehouse operation.
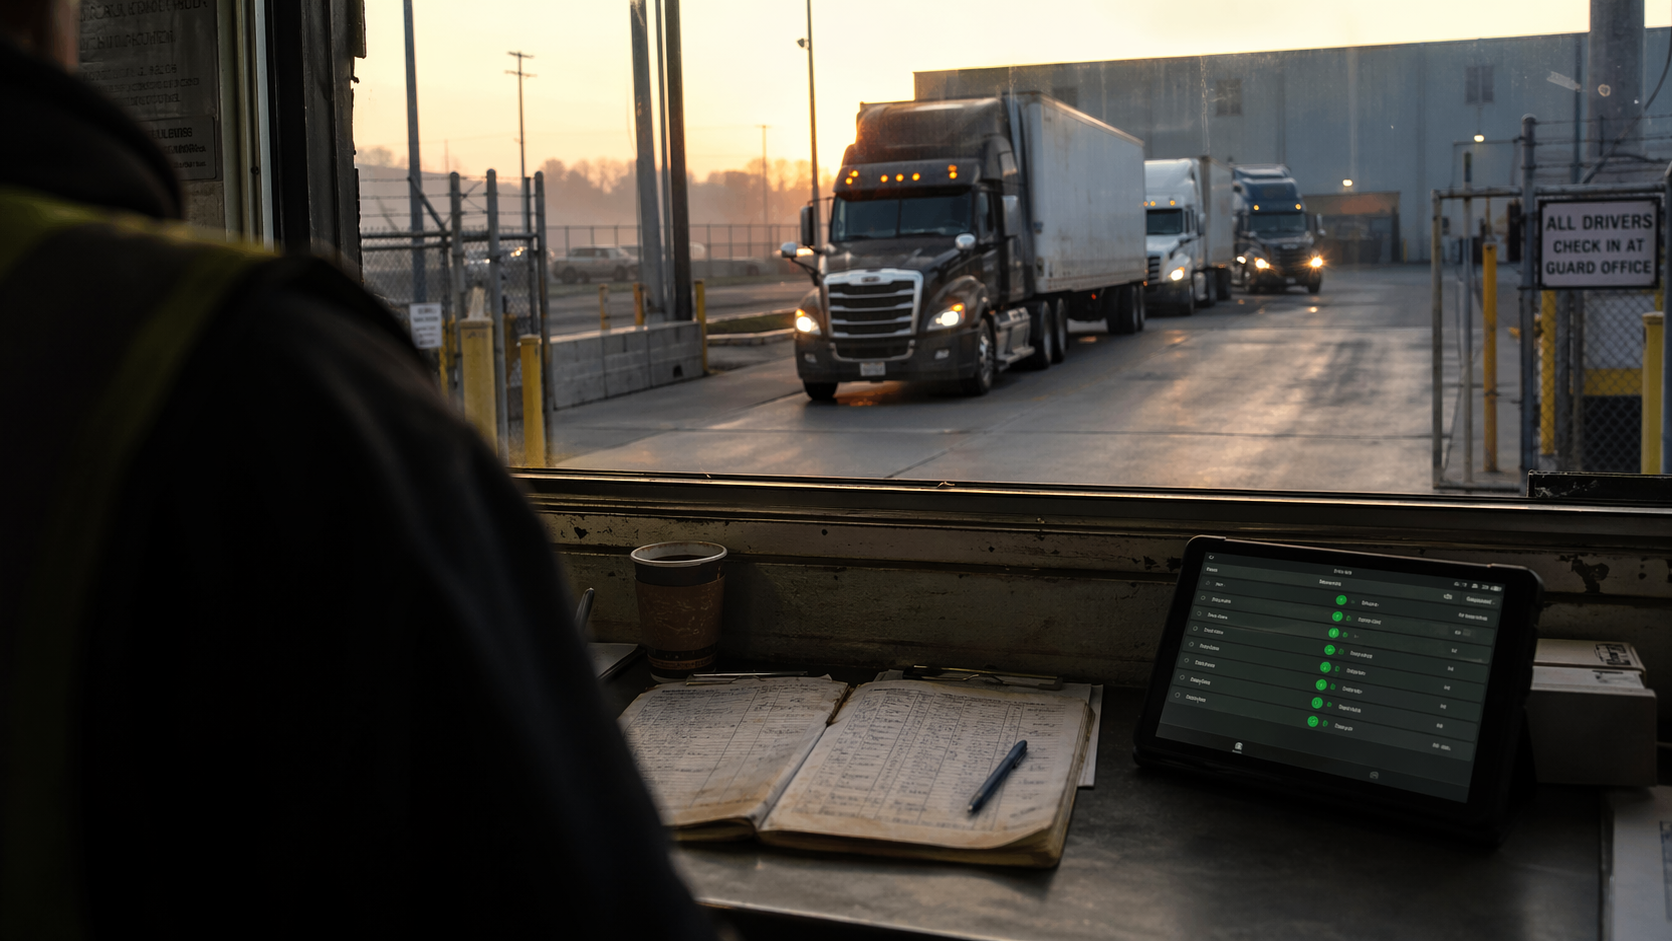
The truck reaches your guard. In a manual operation, check-in means the guard records a license plate, verifies a paper appointment or phone confirmation, checks the carrier against a list, assigns an arrival number, then calls someone to get a dock or yard position. That sequence runs 10–20 minutes per truck on paper.
At 45 trucks per day, a 12-minute average check-in eats 9 hours of gate labor before a single truck has reached a dock. For how digital check-in compresses this, see the digital gate check-in guide.
The truck clears the gate and parks. In operations without yard visibility, this is where most of the time disappears. The truck sits in your yard, occupying a spot, while the coordinator calls dock supervisors to find out which dock just cleared, then calls the guard to relay the assignment, then calls the driver.
Every minute a truck sits here is a yard space that the next truck cannot use.
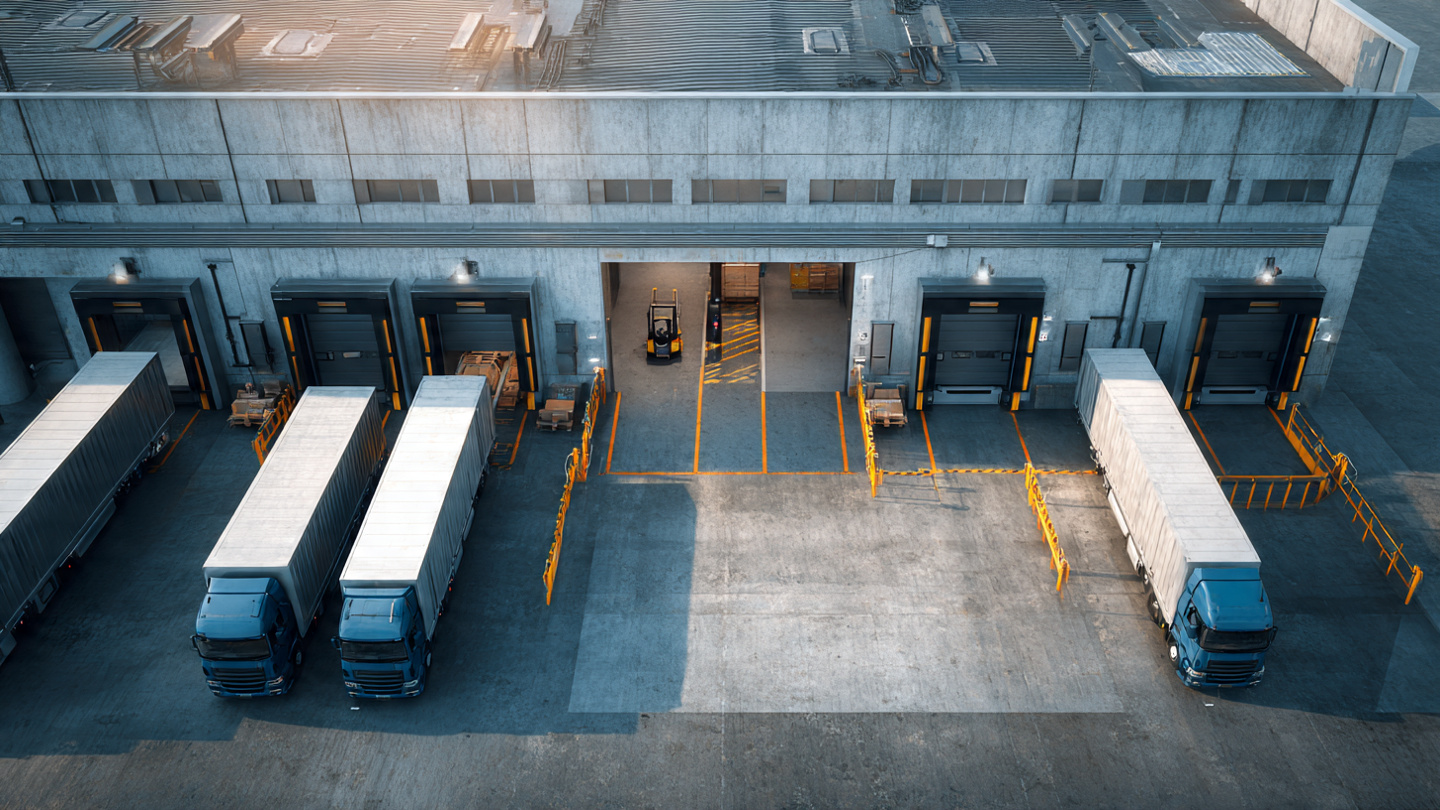
This is the stage most operations actually track. The truck backs in, the dock activates, loading or unloading begins. It has its own inefficiencies (crew readiness, product staging, documentation), but it's the most visible stage and the one most teams already manage. Most dock supervisors know their numbers here.
The truck finishes its load or unload. Now it needs documents signed, a seal assigned, and gate clearance. In a manual operation, the driver walks paperwork to an office, waits for a signature, walks back, and the guard records departure in a notebook. Digital: the system closes the paperwork and the gate gets clearance within seconds.
This stage adds 15 to 30 minutes to total turnaround. Looks minor. Multiply it by 45 trucks a day, five days a week, and it stops looking minor.
Slow turnaround doesn't show up on one line of your P&L. It spreads across four cost layers that most finance teams never trace back to yard operations.
Blocked yard capacity. A truck sitting in your yard 60 extra minutes is a parking spot locked out of rotation. In a 10-spot yard handling 45 trucks a day, a 30-minute average overrun means you need 22% more yard capacity than the operation actually requires, or you run out of space during peak hours.
Throughput reduction. Fewer trucks processed per shift means less product moved. The difference between a 3-hour average turnaround and a 90-minute one, across 45 daily trucks, works out to roughly 15 trucks (nearly a third of daily volume) that either don't get processed or push into overtime.
Labor overhead. When trucks pile up in the yard without visibility, the team compensates manually: the coordinator makes calls, the guard runs between units, the jockey moves trailers on verbal instruction. According to Tideworks, facilities that implement dock scheduling reduce coordination-related labor costs by 25 to 35%.
Cascade congestion. A truck that runs long doesn't only cost its own time. It compresses the slot for every truck behind it. By 2:00 PM, a morning overrun has already forced afternoon rescheduling and carrier friction. This is the most expensive part of chronic high turnaround, and the hardest to see from a spreadsheet.
Use the dwell cost calculator to put a number on what excess turnaround time is costing your operation each month. Enter your dock count, daily truck volume, and average overrun minutes.
Appointment scheduling converts uncontrolled arrival waves into predictable traffic. Carriers book a window before leaving. Trucks that arrive within their window move straight from gate to dock assignment. Those arriving outside it wait in a buffer zone without disrupting the main flow.
According to C3 Solutions, DCs that implement appointment scheduling reduce average turnaround times by 30 to 40%. Almost all of that comes from eliminating pre-gate queue time and yard queuing, the two stages appointments make predictable.
One design detail that matters: windows should be 30 to 60 minutes wide, not fixed times. A carrier arriving 20 minutes into their window processes normally. One arriving 90 minutes early goes to the waiting area, not to the front of the line.
For a complete implementation guide, see dock appointment scheduling: the complete guide for distribution centers.
The target is under 90 seconds. Guard scans a QR code, the system validates the carrier against the appointment, verifies the plate, assigns a yard position. Done.
That needs three things in place: digital appointment confirmation so the guard never searches a list, automatic plate or QR validation so there's no manual lookup, and pre-assigned yard positions so nobody calls anyone to figure out where the truck goes.
Compressing check-in from 15 minutes to 90 seconds across 45 trucks per day recovers over 9 hours of gate labor and removes the bottleneck that feeds the yard queue in the first place.
Yard queuing is almost entirely a visibility problem. The coordinator doesn't know which dock is free. The jockey doesn't know which trailers need moving. The guard doesn't know where to send the next truck. Everyone is working from delayed, verbal information.
A live yard view changes the dynamic: which spots are occupied, which docks are active, which trucks have been waiting longest. When a dock clears, the assignment goes out immediately. The truck moves from yard to dock without a phone call.
Tideworks data shows that facilities with automated dock scheduling see up to 40% reduction in truck turnaround. Most of that comes from Stage 3.
For a full picture of what real-time visibility makes measurable, see the logistics yard KPIs guide.
When a truck finishes unloading, every additional minute it occupies that dock is a minute the next truck cannot use. Most operations treat departure as paperwork. It's actually a dock availability problem.
One digital step fixes it: the dock supervisor marks the truck complete, documentation closes automatically, the gate gets clearance. No paper walk, no signature wait, no guard logging departure times by hand.
Operations that have digitized departure drop from 15 to 30 minutes down to under 3. At 45 trucks per day, that's 540 to 1,350 minutes recovered daily, before you account for the dock availability created downstream.
The aggregate turnaround number tells you something is wrong. Stage-level timestamps tell you where.
Track each transition point: gate-in, yard-arrival, dock-in, dock-out, gate-out. Calculate per-stage averages daily. If Stage 3 runs 80 minutes and Stage 4 runs 45, your problem is yard management, not dock efficiency. If Stage 2 is the outlier, check-in digitization is where to start.
Use the yard operations audit tool to map your current stage times and identify which bottleneck is eating the most throughput.
A consumer goods CEDIS in the Bajío region was processing 52 trucks per day across 10 docks. Average turnaround ran about 3.5 hours. Twelve-hour shifts, with the last two routinely going into overtime to clear the backlog.
A two-week tracking exercise with stage-level timestamps showed this breakdown:
Stages 2, 3, and 5 together: 107 minutes of coordination overhead wrapped around a 48-minute operation. The dock was fine. Everything around it was slow.
After appointment scheduling, digital check-in, and yard visibility went live:
Same docks. Same yard. Different system around them.
Docklyx is built for CEDIS and distribution center operators who need to cut gate-to-gate cycle time without adding headcount or redesigning their yard. It touches every stage.
Carriers self-schedule their arrival window from a mobile portal. No phone calls, no WhatsApp chains. Trucks arrive in controlled waves, and yard queuing drops because the coordinator knows who is coming and when. The morning congestion spike typically disappears within two weeks.
At the gate, the guard scans a QR code or validates a plate. The system verifies the appointment, checks the carrier against the restricted list, and assigns a yard position in under 90 seconds. No notebooks, no calls.
Inside the yard, coordinators and jockeys see a live map: occupied spots, available spots, how long each truck has been waiting. When a dock clears, the assignment goes out immediately. Trucks move on data, not verbal chains.
At the dock, supervisors mark trucks as docked and complete in the system. Time at each dock records automatically. Overruns trigger alerts before they cascade into the afternoon schedule.
And at departure, when dock-out logs, the authorization generates automatically. The gate gets clearance in real time. Truck out in under 3 minutes from completing its operation.
Run the dock capacity calculator to see how many additional trucks your current dock count could handle if turnaround dropped 30%. Most operations find 20–35% of untapped capacity sitting behind coordination overhead.
A DC handling 20 trucks per day has a different bottleneck profile than one handling 80. Before committing to any change, track each stage for two weeks. Even rough manual timestamps will show you where the time piles up.
Stage 3 is your biggest number? Yard visibility first. Stage 2 is the outlier? Digitize check-in. Stage 1 is the problem? Appointment scheduling fixes it before a truck ever reaches your gate.
The yard operations audit tool walks you through this assessment in under an hour, with guided questions that map your current process to the five turnaround stages and show you where to intervene first.
Turnaround time is the number that tells you the truth about your operation. Measure it stage by stage. The rest follows.
Docklyx digitizes the entire yard: appointments, check-in, docks, and real-time traceability.
Request free demo →One email per week. No spam.
Follow a distribution center guard through a full shift and see how digital check-in transforms gate operations.
Prepare your distribution center for peak season surges: dock scheduling, yard staging, and gate check-in strategies to absorb volume spikes.
Your docks are occupied all shift but only produce at 55-65%. Learn how to measure real per-bay productivity and reclaim installed capacity.